Sheerness (Thames Estuary) tide times
Sheerness (Thames Estuary) tide forecast — heights relative to ODN.
Tide chart for Sheerness (Thames Estuary)
24-hour cosine-interpolated curve around the present moment. Heights relative to ODN. Predictions: UK Environment Agency Flood Monitoring.
Sun, moon and conditions on Sun 26 Jul
Snapshot at build time — refreshes daily. Sea state from UK Environment Agency real-time gauges.
Highs and lows next 7 days
Every predicted high and low for the next week, with the daily tidal coefficient (0–120; higher = bigger swing, > 95 means stronger currents).
Other spots nearby
The three closest curated TideTurtle locations to Sheerness (Thames Estuary), measured by great-circle distance.
Today's solunar windows
Solunar tradition: major periods are the ≈3h windows around moon transit and opposition; minor are ≈2h around moonrise and moonset. Pair with the local tide stage and wind for the best read.
About tides at Sheerness (Thames Estuary)
A short guide to the coastline at Sheerness (Thames Estuary) — geography, sea state, and what the tide is actually doing under your feet.
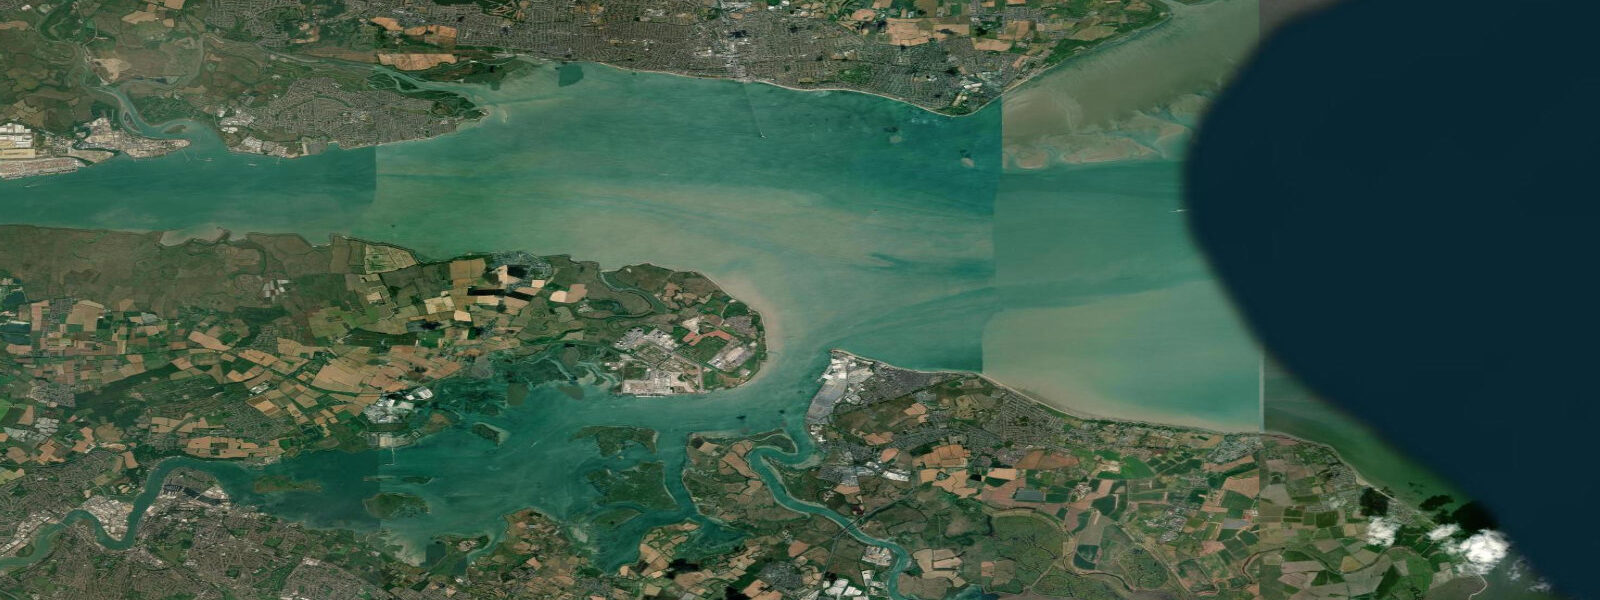
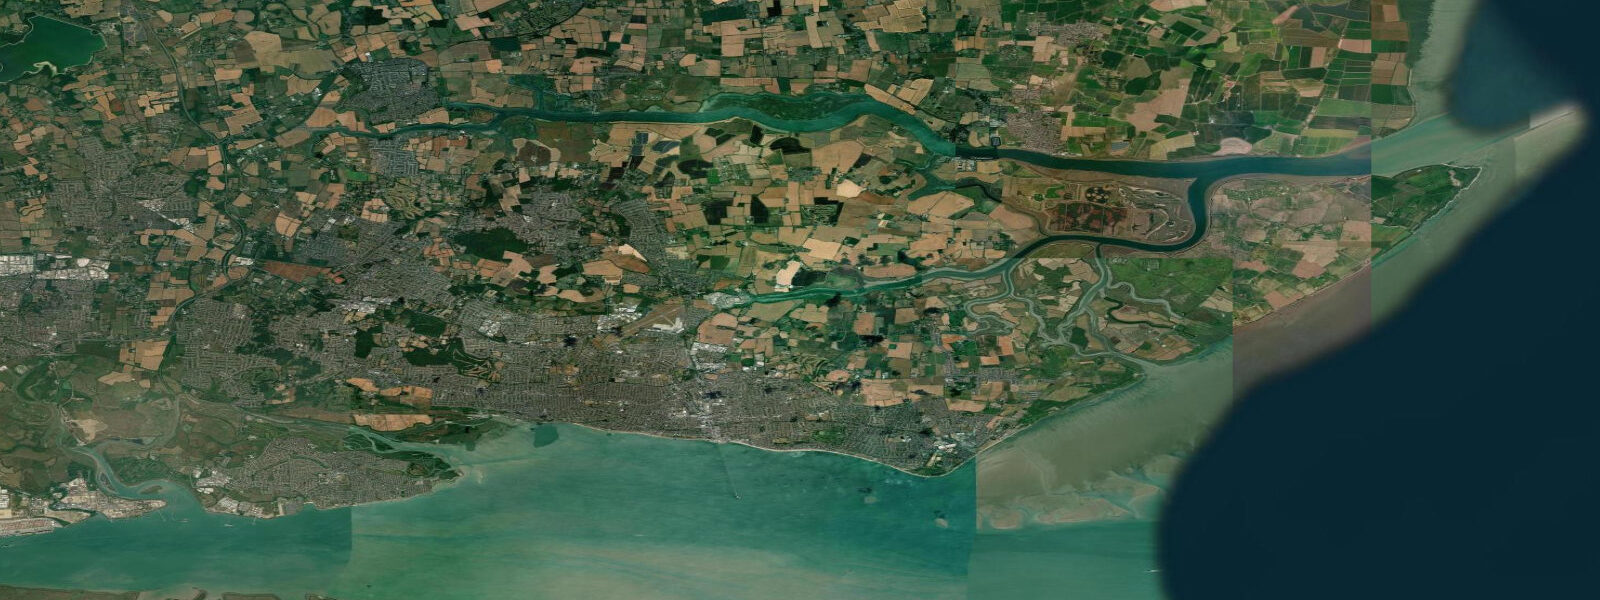
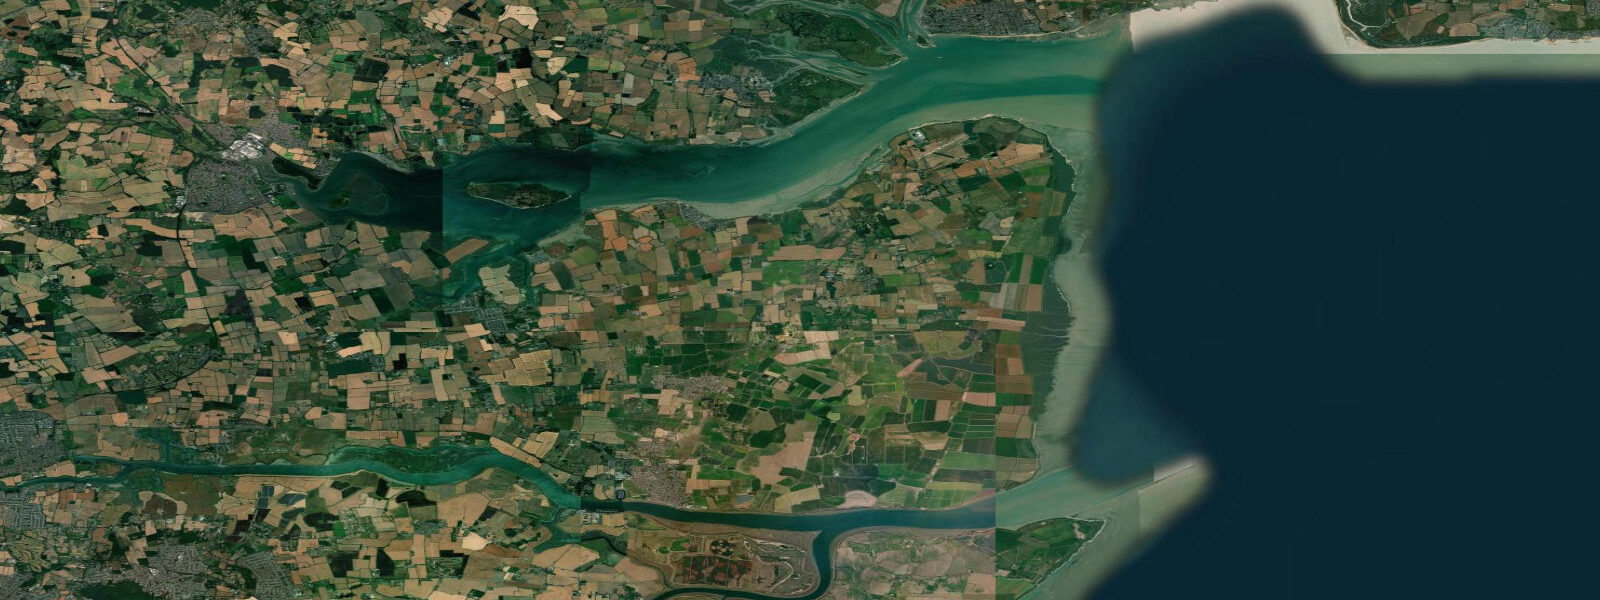
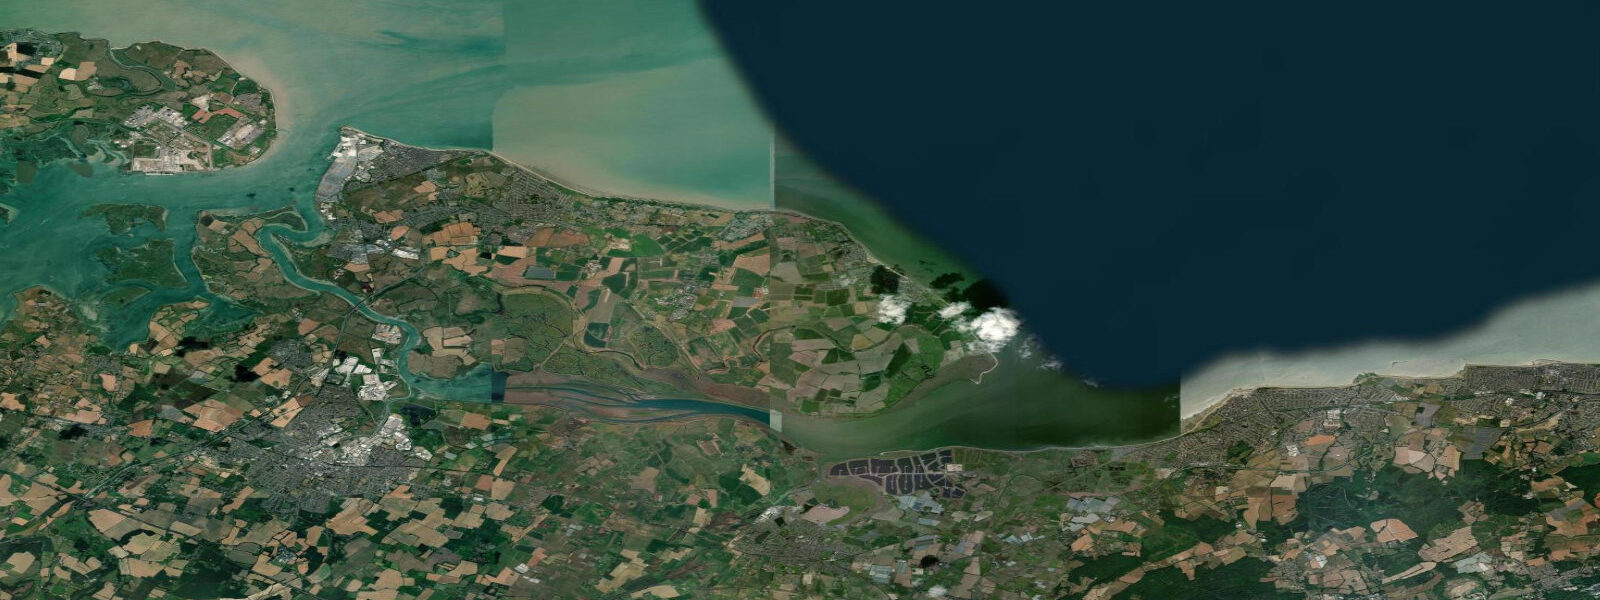
Sheerness sits at the mouth of the Thames Estuary on the Isle of Sheppey, where the river broadens and meets the southern North Sea. The estuary tide is large — mean range about 5 metres, climbing past 6 metres on spring tides. The pattern is semidiurnal, two highs and two lows roughly twelve and a half hours apart.
The swing changes the estuary's look completely: the mudflats off Minster and the saltmarsh around the Medway open up at low water, and the Swale channel running south of Sheppey becomes a network of tidal creeks instead of a single waterway. Sheerness data on this page comes from the UK Environment Agency Flood Monitoring gauge — that's a real-time gauge reading, not a forecast. It reflects actual water level, including weather effects and the storm-surge component during easterly gales.
For tide predictions, the UK Hydrographic Office is the authoritative source. For flood warnings, the Environment Agency's flood-warning service is the live one.
Tide questions about Sheerness (Thames Estuary)
Quick answers to the most common questions about tide times, range, and water access at Sheerness (Thames Estuary).
What does Sheerness gauge data show?
The Sheerness page is built around the UK Environment Agency Flood gauge at station E71539. EA Flood is real-time observation, not prediction, so this site doesn't render a 7-day Sheerness tide table. The page covers local context — typical range, surge behaviour, what the estuary mudflats look like at low water — and links sun and moon for the day. For predicted tide times, see UK Hydrographic Office Admiralty tide tables.
What's the typical tide range at Sheerness?
Mean range at the Thames Estuary mouth is about 5 metres at Sheerness. Spring tides — around new and full moons — push past 6 metres, neaps compress to around 4 metres. The estuary geometry amplifies the open-North-Sea range significantly. Storm surge during easterly gales can lift levels by another metre or more, and the Thames Barrier west of London exists specifically because of this.
Where does this data come from?
UK Environment Agency Flood Monitoring station E71539 at Sheerness Pier — a real-time gauge providing measured water-level data. That's an observation, not a prediction. The EA Flood API publishes the readings on a delay of a few minutes. For predicted tide tables, UK Hydrographic Office Admiralty TotalTide is the authoritative source.
Why does the Thames Estuary have such a big tidal range?
The southern North Sea funnels the rotating tidal wave into the Thames Estuary, and the estuary's funnel shape amplifies the range further. Sheerness near the mouth sees about 5 metres mean range; the range grows into the inner estuary — Tilbury and Tower Pier in central London see comparable swings, with phase delays of an hour or more behind Sheerness.
Is this safe to use for navigation?
No. For piloting in the Thames Estuary use UK Hydrographic Office charts and tide tables plus PLA (Port of London Authority) notices. EA Flood gauge data is useful for storm-surge awareness but is not a navigational chart product.
0-day tide table — Sheerness (Thames Estuary)
Heights relative to ODN. Observation: UK Environment Agency Flood Monitoring (real-time gauge)
| Day | Type | Time | Height |
|---|