Faro, Algarve tide times
Faro, Algarve tide forecast — heights relative to MSL.
Today's tide times for Faro, Algarve
Tide times at Faro, Algarve on Sunday, 26 July 2026: first high tide at 01:00, first low tide at 06:40, second high tide at 12:57, second low tide at 19:15. Sunrise 06:31, sunset 20:44.
Tide chart for Faro, Algarve
24-hour cosine-interpolated curve around the present moment. Heights relative to MSL. Predictions: Predictions: Open-Meteo Marine (MeteoFrance SMOC, 0.08° grid).
Sun, moon and conditions on Sun 26 Jul
Snapshot at build time — refreshes daily. Sea state from Open-Meteo Marine.
Highs and lows next 7 days
Every predicted high and low for the next week, with the daily tidal coefficient (0–120; higher = bigger swing, > 95 means stronger currents).
Other spots nearby
The three closest curated TideTurtle locations to Faro, Algarve, measured by great-circle distance.
Today's solunar windows
Solunar tradition: major periods are the ≈3h windows around moon transit and opposition; minor are ≈2h around moonrise and moonset. Pair with the local tide stage and wind for the best read.
Cycle dates near Faro, Algarve
Next spring tide on Sat 01 Aug (range 2.6m). Last neap on Sun 26 Jul.
Spring tides cluster around new and full moons (biggest swings). Neap tides land on quarter moons (smallest swings). See the spring tide and neap tide glossary entries for the why.
About tides at Faro, Algarve
A short guide to the coastline at Faro, Algarve — geography, sea state, and what the tide is actually doing under your feet.
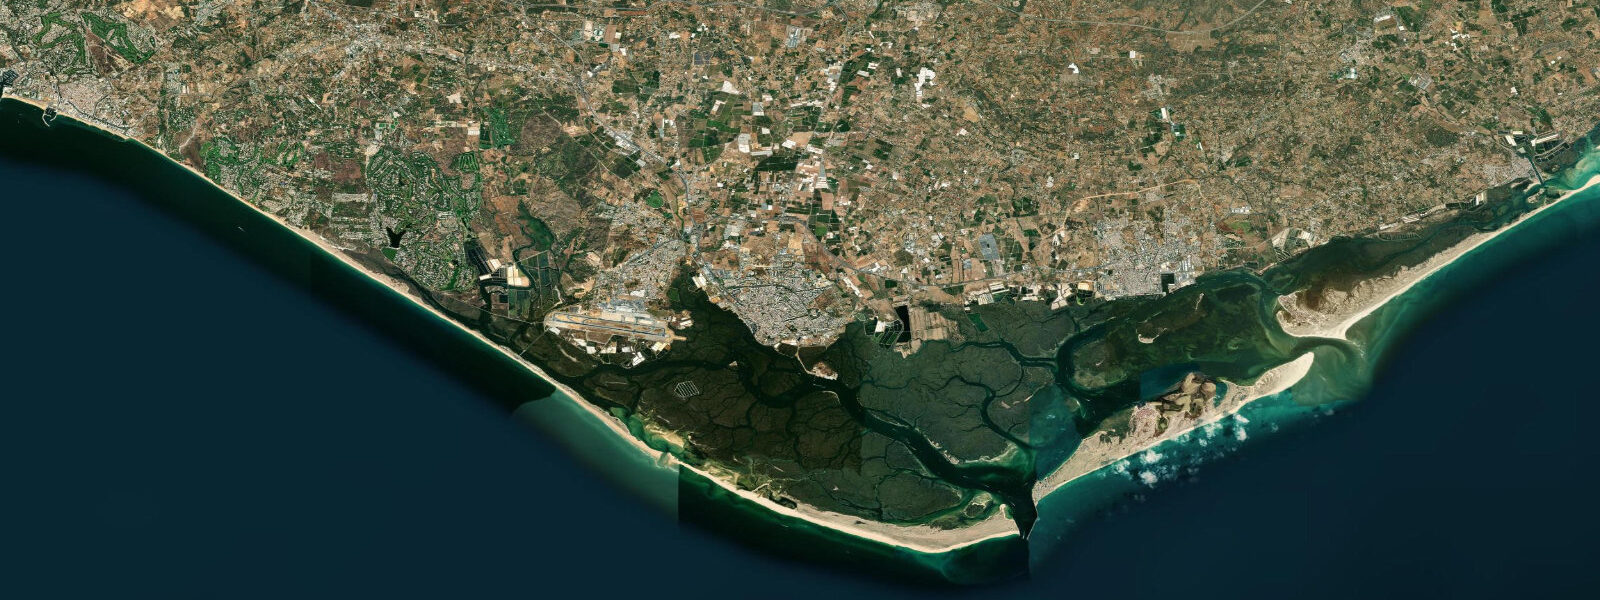
Faro sits on the Ria Formosa, the long sheltered lagoon that runs along the central Algarve coast, separated from the open Atlantic by a chain of sandy barrier islands. 0. The pattern is two highs and two lows about twelve and a half hours apart.
The lagoon drains and refills through narrow inlets — Barra Nova, Barra de Faro-Olhão, Barra de Armona — and the current at each runs sharper than the height swing implies. The salt pans, the bird-rich mudflats, and the channels behind the barrier islands all transform across the cycle. Walkers on the Ilha Deserta or Ilha do Farol time their boat-hop trips to the falling and rising tide; flamingo and spoonbill watchers head out at the bottom of the cycle when the flats are widest.
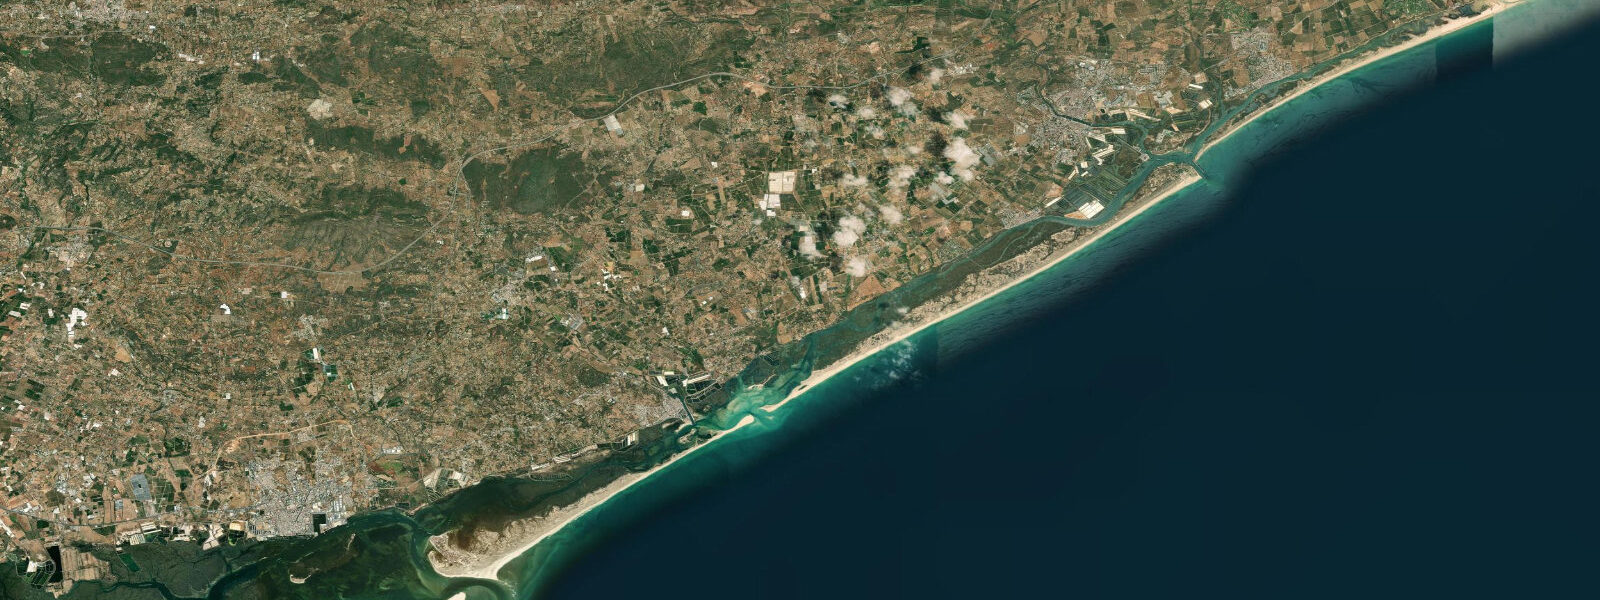
The open beach at Praia de Faro narrows on the high and widens by 15–20 metres on the low. Predictions come from Open-Meteo Marine, gridded model output — useful for planning, not navigation-grade. Instituto Hidrográfico is the authoritative Portuguese tide source.
Tide questions about Faro, Algarve
Quick answers to the most common questions about tide times, range, and water access at Faro, Algarve.
When is the next high tide at Faro?
The hero block shows the next high tide at the Faro reference in local Lisbon time, height above MSL. The 7-day table covers daily highs and lows. High water at the inner Faro waterfront lags the open inlets by 30–45 minutes because the lagoon takes time to fill through the narrow barrier-island gaps.
What's the typical tide range at Faro?
Mean range at the Faro inlets is about 2.0 metres. Spring tides — around new and full moons — push close to 3 metres, neaps compress to around 1.0. The Algarve coast runs slightly smaller swings than the Tagus mouth at Lisbon (about 2.4 metres mean), and the lagoon geometry damps the inland swing further.
When are the best low tides for birdwatching the Ria Formosa?
The Ria Formosa is one of the best wetland-bird areas in Europe — flamingo, spoonbill, sandpiper, oystercatcher. The widest flats are exposed at the lowest predicted lows of the month, which cluster around new and full moons. An hour either side of the bottom of the cycle gives the most exposed mud and the most concentrated bird activity. The 7-day table flags each day's predicted low.
Where do these tide predictions come from?
Open-Meteo Marine, a gridded global ocean-model. Useful general planning data for the Algarve, but not navigation-grade. For authoritative Portuguese tide data, including the official gauges along the Algarve, see Instituto Hidrográfico (IH) tide tables.
Is this safe to use for navigation?
No. For piloting in or out of the Ria Formosa inlets, the open Algarve coast, or any of the barrier-island channels use Instituto Hidrográfico's authoritative tide tables and chart products plus the latest navigational warnings. Open-Meteo's gridded predictions are general-planning data, not a navigational source.
7-day tide table — Faro, Algarve
Heights relative to MSL. Predictions: Open-Meteo Marine (MeteoFrance SMOC, 0.08° grid) — heights relative to MSL (not chart datum / LAT). Model-derived.
| Day | Type | Time | Height |
|---|---|---|---|
| Sun 26 Jul | High | 01:00 | 0.2m |
| Low | 06:40 | -1.0m | |
| High | 12:57 | 0.5m | |
| Low | 19:15 | -1.2m | |
| Mon 27 Jul | High | 01:27 | 0.4m |
| Low | 07:20 | -1.2m | |
| High | 13:41 | 0.6m | |
| Low | 19:54 | -1.3m | |
| Tue 28 Jul | High | 02:02 | 0.5m |
| Low | 07:58 | -1.3m | |
| Wed 29 Jul | High | 14:50 | 0.9m |
| Low | 21:01 | -1.5m | |
| Thu 30 Jul | High | 03:10 | 0.6m |
| Low | 09:03 | -1.5m | |
| High | 15:21 | 0.9m | |
| Low | 21:32 | -1.6m | |
| Fri 31 Jul | High | 03:42 | 0.7m |
| Low | 09:36 | -1.5m | |
| High | 15:53 | 1.0m | |
| Low | 22:04 | -1.6m | |
| Sat 01 Aug | High | 04:12 | 0.8m |
| Low | 10:08 | -1.5m | |
| High | 16:24 | 1.0m | |
| Low | 22:38 | -1.6m |