Scheveningen, South Holland tide times
Scheveningen, South Holland tide forecast — heights relative to MSL.
Today's tide times for Scheveningen, South Holland
Tide times at Scheveningen, South Holland on Sunday, 26 July 2026: first high tide at 02:00, first low tide at 06:19, second low tide at 08:54, second high tide at 14:37, third low tide at 18:19, fourth low tide at 21:00. Sunrise 05:53, sunset 21:44.
Tide chart for Scheveningen, South Holland
24-hour cosine-interpolated curve around the present moment. Heights relative to MSL. Predictions: Predictions: Open-Meteo Marine (MeteoFrance SMOC, 0.08° grid).
Sun, moon and conditions on Sun 26 Jul
Snapshot at build time — refreshes daily. Sea state from Open-Meteo Marine.
Highs and lows next 7 days
Every predicted high and low for the next week, with the daily tidal coefficient (0–120; higher = bigger swing, > 95 means stronger currents).
Other spots nearby
The three closest curated TideTurtle locations to Scheveningen, South Holland, measured by great-circle distance.
Today's solunar windows
Solunar tradition: major periods are the ≈3h windows around moon transit and opposition; minor are ≈2h around moonrise and moonset. Pair with the local tide stage and wind for the best read.
Cycle dates near Scheveningen, South Holland
Next spring tide on Mon 27 Jul (range 1.9m). Next neap on Wed 29 Jul.
Spring tides cluster around new and full moons (biggest swings). Neap tides land on quarter moons (smallest swings). See the spring tide and neap tide glossary entries for the why.
About tides at Scheveningen, South Holland
A short guide to the coastline at Scheveningen, South Holland — geography, sea state, and what the tide is actually doing under your feet.
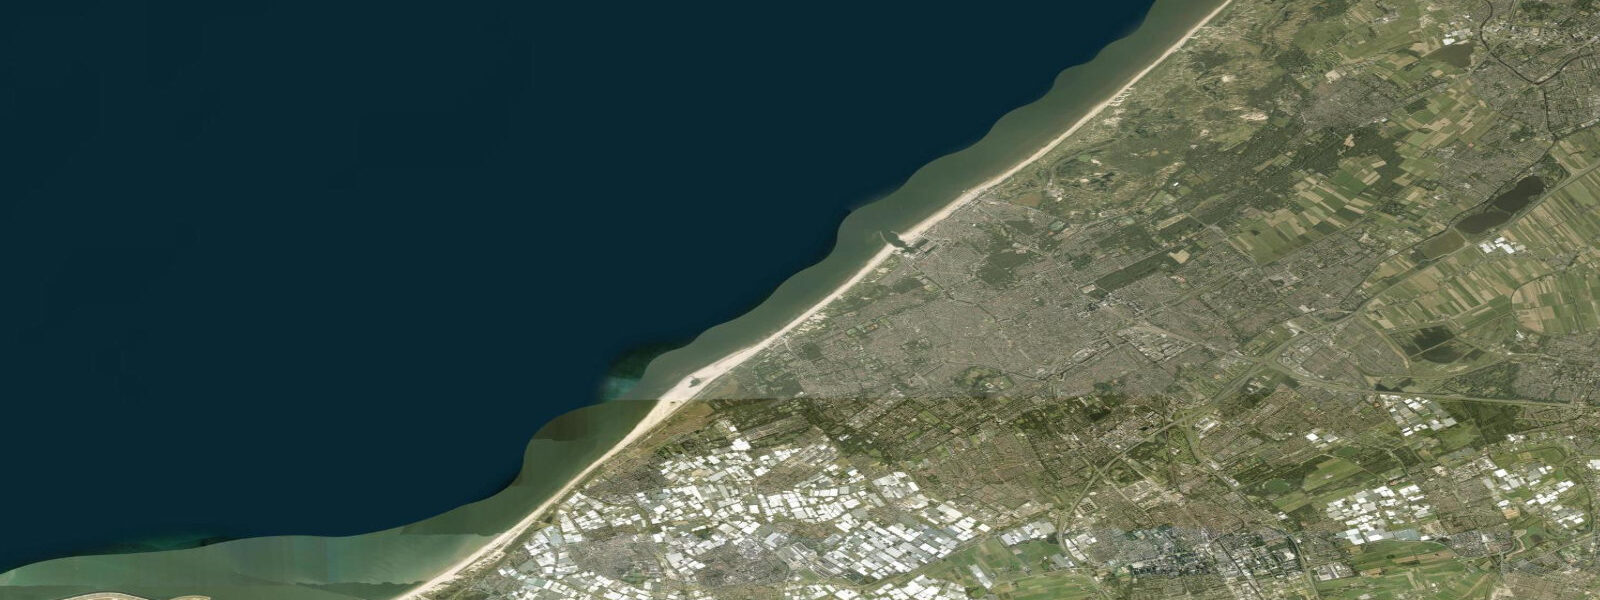
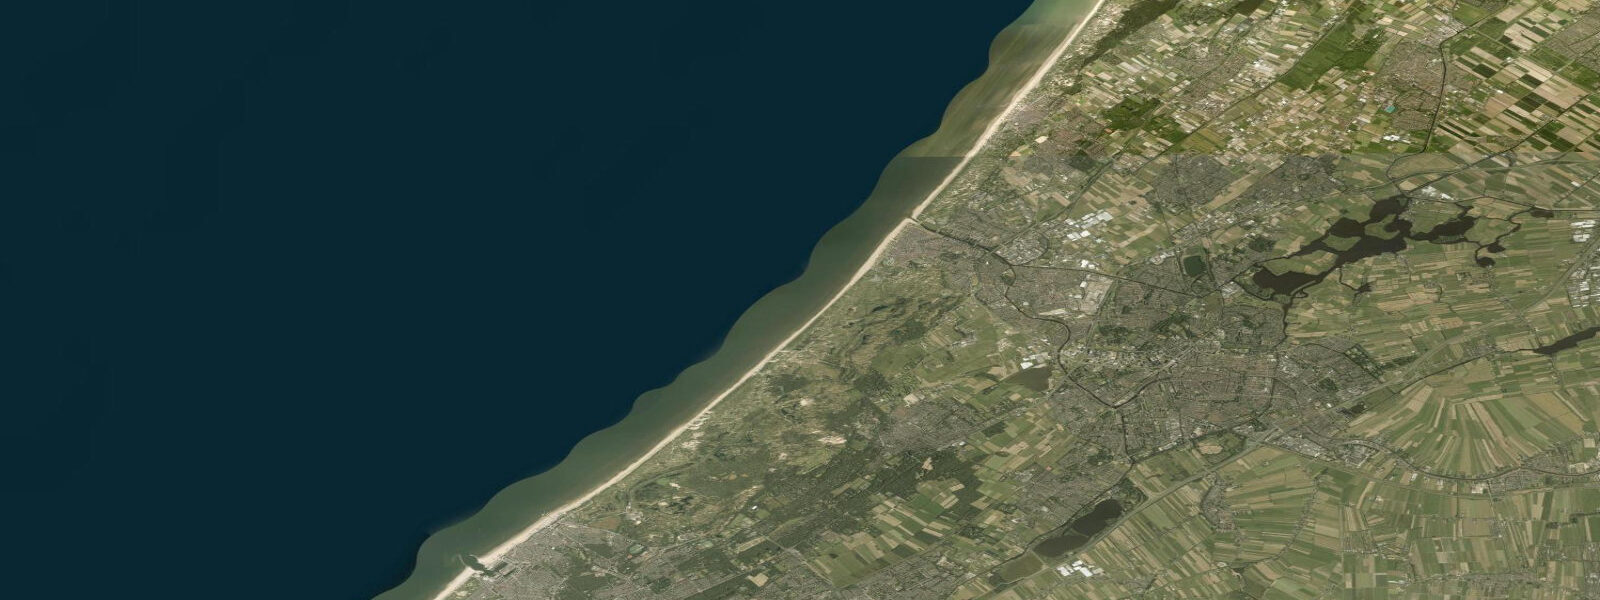
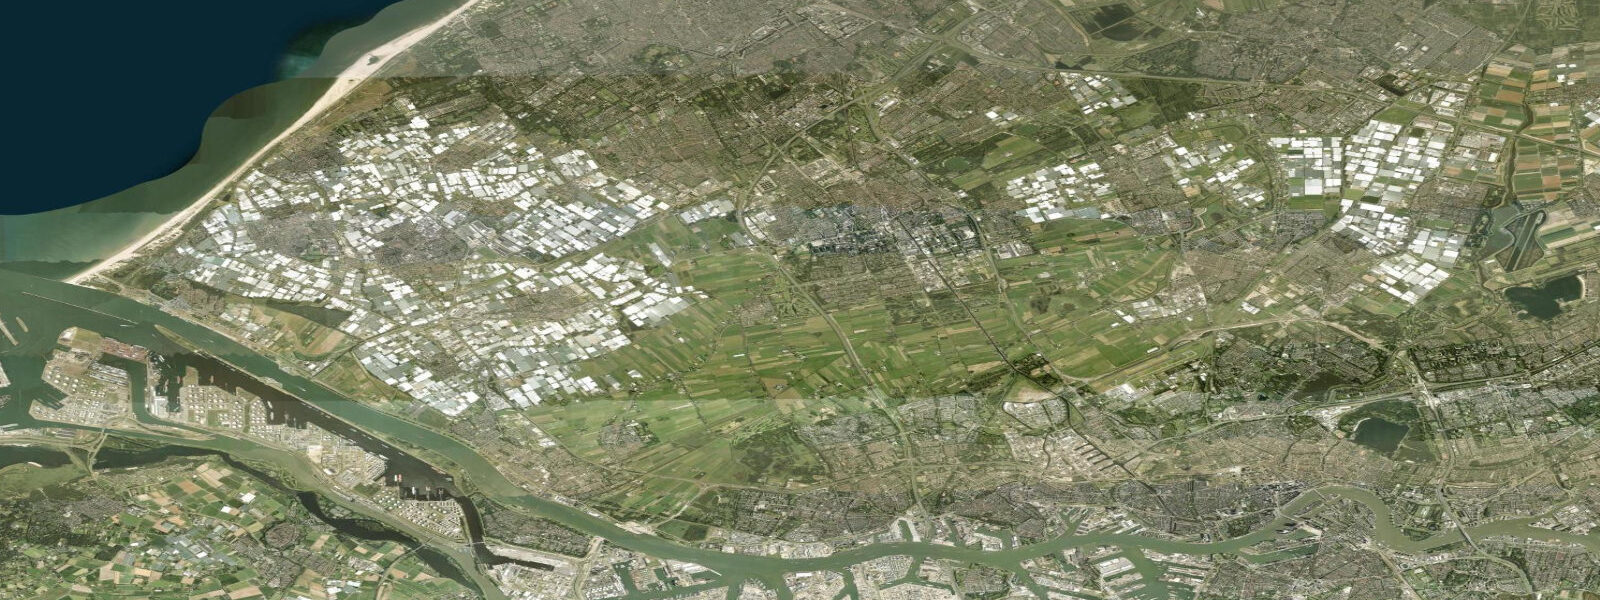
Scheveningen sits on the open North Sea coast on the western edge of The Hague, with the long sand-and-dune shoreline running south past the Hook of Holland to the Maasvlakte and the Delta Works, and north past Wassenaar and Katwijk to the IJmuiden lock and Zandvoort. The harbour itself is one of the busiest small fishing and recreational ports on the Dutch coast, separated from the open beach by a pair of stone breakwaters that frame the harbour entrance. The tide here runs the southern North Sea signature: cleanly semidiurnal, two highs and two lows of comparable size each day, twelve and a half hours apart.
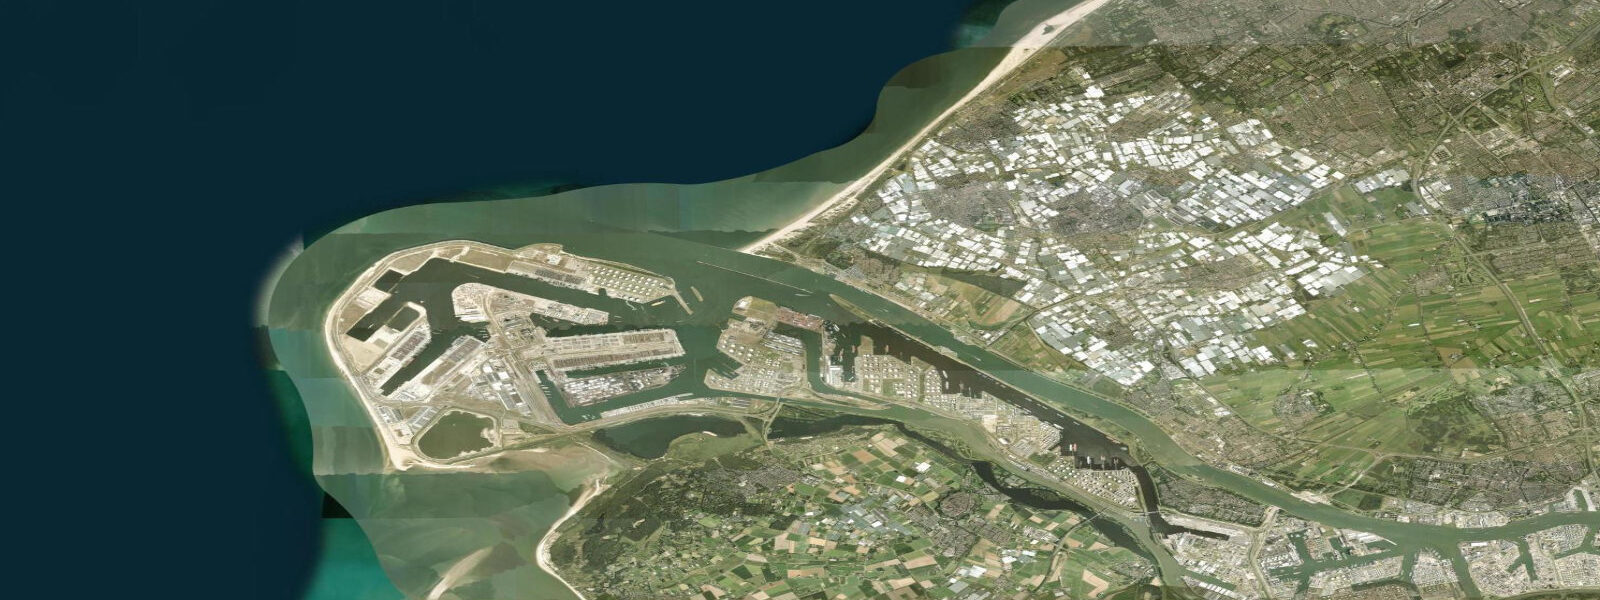
2 on neaps. Inside Rotterdam Europoort just to the south the propagating tide reaches the harbour about 30 to 60 minutes behind the open coast, with the working pilots on the New Waterway timing approaches by the slack on the rising flood. Beach walkers reading for the wide-sand windows at the bottom of the cycle, kitesurfers at the breakwater wing, swimmers on the long stretch from Scheveningen Strand south to Kijkduin, and the local fishing fleet leaving the inner harbour for the open North Sea each read the table for different reasons.
Lowest spring lows around new and full moons open the inner-shelf sandbanks for hours either side. Open-Meteo Marine drives the gridded predictions on this page; for authoritative Dutch tide data, Rijkswaterstaat operates the Scheveningen gauge as part of the national network and publishes the official tide tables. Storm-surge events in winter from North Sea low-pressure systems can lift levels well above predicted, and the Maeslantkering storm-surge barrier at the New Waterway is designed to close when forecast water exceeds 3 metres above NAP at Hoek van Holland.
Tide questions about Scheveningen, South Holland
Quick answers to the most common questions about tide times, range, and water access at Scheveningen, South Holland.
When is the next high tide at Scheveningen?
The hero block shows the next high tide at the Scheveningen gauge in local Dutch time (CET in winter, CEST in summer). The 7-day table covers all the highs and lows. High water at Hoek van Holland just to the south arrives close to the same time as Scheveningen; inside Rotterdam Europoort it lags by 30 to 60 minutes.
What's the typical tide range at Scheveningen?
Mean range is about 1.7 metres, climbing past 2.0 metres on spring tides around new and full moons and dropping near 1.2 metres on neaps. The pattern is cleanly semidiurnal — two highs and two lows of comparable size each day, twelve and a half hours apart, the standard southern North Sea signal.
Where do these tide predictions come from?
Open-Meteo Marine, a gridded global ocean model. Useful for daily planning around the Scheveningen beach and harbour. For authoritative Dutch tide data, Rijkswaterstaat operates the Scheveningen gauge as part of the national network and publishes the official tide tables for navigation along the entire Dutch coast and the Wadden Sea.
Are storm-surge events a concern at Scheveningen?
Yes — winter North Sea low-pressure systems combined with northwest gales can lift water levels well above predicted. The 1953 North Sea flood overtopped the southern Delta and triggered the construction of the Delta Works dam network, including the Maeslantkering storm-surge barrier across the New Waterway south of Scheveningen. The barrier is designed to close when forecast water exceeds 3 metres above NAP at Hoek van Holland.
Is this safe to use for navigation?
No. For piloting in or out of the Scheveningen harbour, transiting the New Waterway approach, or working the open Dutch coast use Rijkswaterstaat's authoritative tide tables, the Dutch hydrographic service notices to mariners, and the harbour-master's guidance for the Scheveningen breakwaters. Northwest gales build short steep seas on the breakwater entrance that are a working hazard.
7-day tide table — Scheveningen, South Holland
Heights relative to MSL. Predictions: Open-Meteo Marine (MeteoFrance SMOC, 0.08° grid) — heights relative to MSL (not chart datum / LAT). Model-derived.
| Day | Type | Time | Height |
|---|---|---|---|
| Sun 26 Jul | High | 02:00 | 0.9m |
| Low | 06:19 | -0.5m | |
| Low | 08:54 | -0.6m | |
| High | 14:37 | 0.6m | |
| Low | 18:19 | -0.8m | |
| Low | 21:00 | -0.7m | |
| Mon 27 Jul | High | 02:55 | 0.8m |
| Low | 06:54 | -0.5m | |
| Low | 09:51 | -0.6m | |
| High | 15:01 | 0.5m | |
| Low | 19:12 | -1.0m | |
| Low | 22:03 | -1.0m | |
| Tue 28 Jul | High | 03:42 | 0.6m |
| Low | 07:26 | -0.7m | |
| High | 08:37 | -0.6m | |
| Low | 10:43 | -0.9m | |
| High | 15:47 | 0.5m | |
| Low | 20:03 | -0.9m | |
| High | 20:56 | -0.9m | |
| Low | 22:58 | -1.1m | |
| Wed 29 Jul | High | 04:25 | 0.6m |
| Low | 08:13 | -0.6m | |
| High | 09:13 | -0.5m | |
| Low | 11:37 | -0.9m | |
| High | 15:50 | 0.5m | |
| Low | 20:27 | -1.0m | |
| High | 21:51 | -0.8m | |
| Low | 23:43 | -1.1m | |
| Thu 30 Jul | High | 09:51 | -0.5m |
| Low | 12:19 | -0.9m | |
| High | 16:13 | 0.6m | |
| Fri 31 Jul | Low | 00:31 | -1.2m |
| High | 04:43 | 0.7m | |
| Low | 12:57 | -0.9m | |
| High | 16:40 | 0.7m | |
| Low | 22:03 | -1.0m | |
| High | 23:10 | -0.9m | |
| Sat 01 Aug | Low | 01:02 | -1.1m |
| High | 05:12 | 0.9m | |
| Low | 10:20 | -0.6m | |
| High | 11:07 | -0.5m | |
| Low | 13:44 | -0.9m | |
| High | 17:13 | 0.7m | |
| Low | 22:35 | -1.2m |