Cape Charles tide times
Cape Charles tide forecast — heights relative to MSL.
Today's tide times for Cape Charles
Tide times at Cape Charles on Friday, 19 June 2026: first low tide at 06:36am, first high tide at 12:56pm, second low tide at 06:35pm. Sunrise 05:43am, sunset 08:27pm.
Tide chart for Cape Charles
24-hour cosine-interpolated curve around the present moment. Heights relative to MSL. Predictions: Predictions: Open-Meteo Marine (MeteoFrance SMOC, 0.08° grid).
Sun, moon and conditions on Fri 19 Jun
Snapshot at build time — refreshes daily. Sea state from Open-Meteo Marine.
Highs and lows next 7 days
Every predicted high and low for the next week, with the daily tidal coefficient (0–120; higher = bigger swing, > 95 means stronger currents).
Other spots nearby
The three closest curated TideTurtle locations to Cape Charles, measured by great-circle distance.
Today's solunar windows
Solunar tradition: major periods are the ≈3h windows around moon transit and opposition; minor are ≈2h around moonrise and moonset. Pair with the local tide stage and wind for the best read.
Cycle dates near Cape Charles
Last spring tide on Thu 18 Jun (range 0.7m / 2.3ft). Next neap on Mon 22 Jun.
Spring tides cluster around new and full moons (biggest swings). Neap tides land on quarter moons (smallest swings). See the spring tide and neap tide glossary entries for the why.
About tides at Cape Charles
A short guide to the coastline at Cape Charles — geography, sea state, and what the tide is actually doing under your feet.
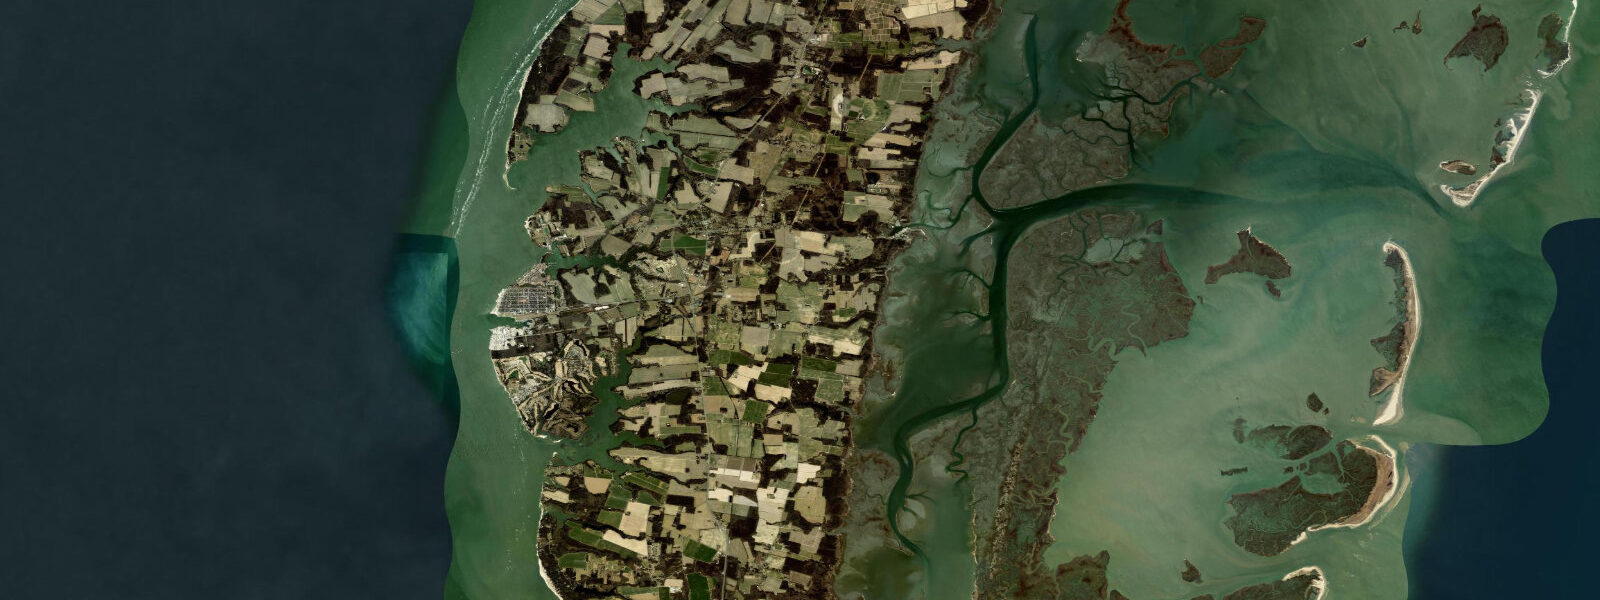
Cape Charles occupies the southern tip of the Delmarva Peninsula, where the Chesapeake Bay narrows before the Bay Bridge-Tunnel carries US-13 across to Hampton Roads. The town faces west into the bay — a calmer orientation than the Atlantic side — and the tidal range here sits around 0.7 to 0.8 metres on a mean cycle, rising to about 1.0 m on spring tides. The water is brackish and murky compared to Atlantic beaches, but the softshell crab harvest and the osprey population make it unmistakably bay country.
The public beach is on the bay side, which means protected water and flat-to-gentle waves. It's a genuine wading beach for families, safe at all but the highest tides when surge can push the waterline to the seawall. The harbour sits just north of the beach; kayak launches are easy from the boat ramp at the marina. Mid-tide is best — low water exposes shallow mud near the dock, and high water gives a cleaner run out to the deeper channel.
The waters off the southern Chesapeake are famous for cobia in summer. Cape Charles is one of the closest launch points for bay anglers targeting cobia on the incoming tide along the deep channel edges near the mouth of the bay. The cobia season runs May through August; the fish follow rays and sharks into the upper water column, and sight-fishing from a centre-console is common. Flounder hold in the deeper holes near the Chesapeake Bay Bridge-Tunnel islands.
Sunsets from the Cape Charles beach are among the better ones on the mid-Atlantic coast — the bay opens west and the sky above Hampton Roads lights up on clear evenings. Photographers get best light from 90 minutes before sunset to about 15 minutes after; the low, flat horizon means no obstructions. Plan to arrive before high tide if you want firm sand to stand on.
The town itself is a preserved Victorian railroad town with a small but growing restaurant scene. The historic district is walkable from the beach. The train ferry era (pre-tunnel) is documented in the town museum — Cape Charles was the northern terminus of the ferry route to Norfolk for much of the 20th century.
For anglers, the Chesapeake Bay Bridge-Tunnel structure creates the most productive structure fishing in Virginia. The four artificial islands are accessible only by boat; fishing is legal around the bridge pilings. Striped bass, flounder, and gray trout concentrate around the structure on tidal current changes.
Predictions on this page come from Open-Meteo Marine, a gridded global ocean model. Accuracy is typically within plus or minus 45 minutes on timing and 0.2 to 0.3 metres on height — model-derived, not from a local gauge. For authoritative US tide data, consult NOAA CO-OPS at tidesandcurrents.noaa.gov.
Tide questions about Cape Charles
Quick answers to the most common questions about tide times, range, and water access at Cape Charles.
What is the tidal range at Cape Charles?
Cape Charles sits inside the lower Chesapeake Bay, which has a moderate semidiurnal tidal pattern. Mean range is roughly 0.7 to 0.8 metres, with springs reaching around 1.0 m. The bay orientation means wind-driven water level changes can exceed the astronomical tide on stormy days — northerly winds push water out, southerly winds pile it in.
Is the Cape Charles beach good for swimming?
Yes — the bay-side beach is calm, with flat to very gentle waves year-round. Water clarity is lower than Atlantic beaches (bay water is naturally turbid), but there are no surf or rip current hazards. The bottom is sandy with occasional shell hash. Lifeguards are seasonal (late June through Labor Day); outside those dates the beach is unguarded. Jellyfish, primarily stinging nettles, appear from July through September.
When is the best time to fish for cobia near Cape Charles?
Cobia enter the lower Chesapeake in May and peak in June through July. They're commonly spotted on the surface following cownose rays in the main bay channel south of Cape Charles. The fish move north into the bay as summer progresses. Most boats target them on incoming tides when rays move into shallower water. A Virginia saltwater fishing license is required.
Can I kayak to the Chesapeake Bay Bridge-Tunnel from Cape Charles?
The southern span of the CBBT is about 3.5 nautical miles from the Cape Charles harbour — feasible in flat conditions for experienced sea kayakers, but the crossing involves shipping lanes and unpredictable wind acceleration around the bridge structure. Fishing from kayaks around the bridge pilings is technically legal but the tidal current there can run 2+ knots on springs. This is an advanced open-water crossing, not a beginner paddle.
What wildlife can I see from the Cape Charles waterfront?
Ospreys nest on navigational markers throughout the harbour from March through August. Brown pelicans have expanded their range north and are now a regular sight in summer. Bottlenose dolphins feed in the main channel, particularly on the afternoon flood tide. Horseshoe crab spawning peaks in May on the beach — low-water mornings just after full or new moon are the best timing to witness it.
7-day tide table — Cape Charles
Heights relative to MSL. Predictions: Open-Meteo Marine (MeteoFrance SMOC, 0.08° grid) — heights relative to MSL (not chart datum / LAT). Model-derived.
| Day | Type | Time | Height |
|---|---|---|---|
| Fri 19 Jun | Low | 06:36 | -0.8m / -2.7ft |
| High | 12:56 | -0.1m / -0.4ft | |
| Low | 18:35 | -0.7m / -2.5ft | |
| Sat 20 Jun | High | 00:52 | -0.0m / -0.0ft |
| Low | 19:50 | -0.7m / -2.2ft | |
| Sun 21 Jun | High | 01:21 | -0.1m / -0.4ft |
| Low | 08:10 | -0.8m / -2.7ft | |
| Mon 22 Jun | — | ||
| Tue 23 Jun | High | 03:15 | -0.2m / -0.8ft |
| Low | 09:55 | -0.8m / -2.5ft | |
| High | 16:18 | -0.2m / -0.7ft | |
| Low | 22:21 | -0.7m / -2.2ft | |
| Wed 24 Jun | High | 04:18 | -0.3m / -0.9ft |
| Low | 10:37 | -0.8m / -2.5ft | |
| High | 17:20 | -0.1m / -0.4ft | |
| Thu 25 Jun | Low | 11:18 | -0.8m / -2.5ft |
| High | 18:00 | -0.2m / -0.5ft | |