Astoria (Columbia River), OR tide times
Astoria (Columbia River), OR tide forecast — heights relative to MLLW.
Today's tide times for Astoria (Columbia River), OR
Tide times at Astoria (Columbia River), OR on Saturday, 25 July 2026: first low tide at 05:11pm, first high tide at 11:06pm. Sunrise 05:49am, sunset 08:54pm.
Tide chart for Astoria (Columbia River), OR
24-hour cosine-interpolated curve around the present moment. Heights relative to MLLW. Predictions: NOAA CO-OPS station 9439040.
Sun, moon and conditions on Sat 25 Jul
Snapshot at build time — refreshes daily. Sea state from NOAA harmonic predictions.
Highs and lows next 7 days
Every predicted high and low for the next week, with the daily tidal coefficient (0–120; higher = bigger swing, > 95 means stronger currents).
Other spots nearby
The three closest curated TideTurtle locations to Astoria (Columbia River), OR, measured by great-circle distance.
Today's solunar windows
Solunar tradition: major periods are the ≈3h windows around moon transit and opposition; minor are ≈2h around moonrise and moonset. Pair with the local tide stage and wind for the best read.
Cycle dates near Astoria (Columbia River), OR
Next spring tide on Wed 29 Jul (range 2.8m / 9.3ft). Last neap on Sat 25 Jul. Next neap on Sun 02 Aug.
Spring tides cluster around new and full moons (biggest swings). Neap tides land on quarter moons (smallest swings). See the spring tide and neap tide glossary entries for the why.
About tides at Astoria (Columbia River), OR
A short guide to the coastline at Astoria (Columbia River), OR — geography, sea state, and what the tide is actually doing under your feet.
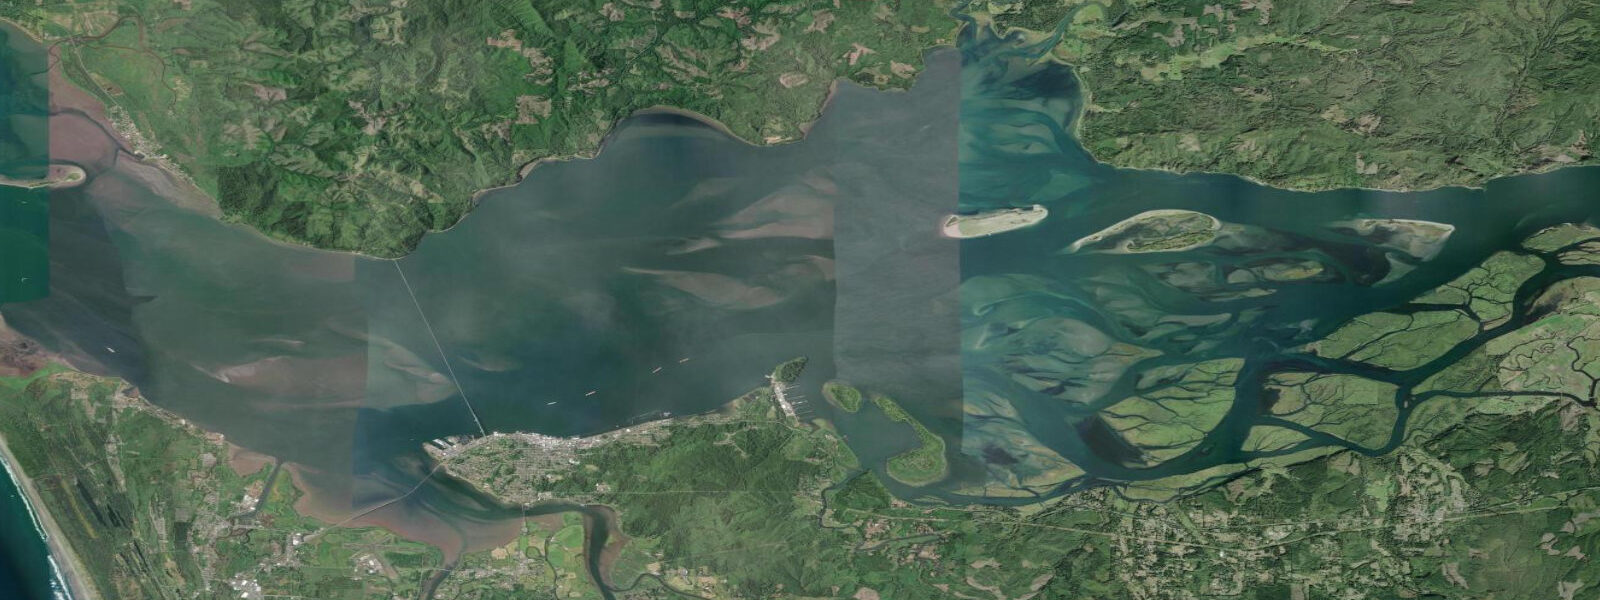
Astoria sits on the south bank of the Columbia River near its mouth, where the second-largest river by volume in the United States meets the Pacific across one of the most dangerous bar crossings in North America. The tide gauge at the Tongue Point pier reads a complicated signal: the open-Pacific mixed-semidiurnal tide pushing inland against the river's seaward current. 9 on spring tides.
The pattern is mixed semidiurnal, two highs and two lows of unequal size each day, the bigger swing falling on the lower-low water. The Columbia Bar at the mouth — between the south jetty at Fort Stevens and the north jetty across in Washington — is the ship-traffic chokepoint, and the rip and breaking water at the bar on a strong ebb against an incoming Pacific swell is what the Coast Guard's motor lifeboat school exists to train against. Photographers on the Astoria Riverwalk and bird-walkers at the Trestle Bay reserve at the Lewis and Clark NWR read the table for the lowest lows and the calm slack-water windows.
Predictions on this page come from NOAA CO-OPS station 9439040. Pacific storm surge in winter can lift water levels 20 cm or more above predicted; the table assumes calm.
Tide questions about Astoria (Columbia River), OR
Quick answers to the most common questions about tide times, range, and water access at Astoria (Columbia River), OR.
When is the next high tide at Astoria?
The hero block shows the next high tide at the Tongue Point gauge in local Pacific time. The 7-day table covers all four daily extremes. River discharge from the Columbia adds a non-tidal component to actual water levels, especially during spring runoff in May and June; harmonic predictions describe the astronomical tide only.
What's the typical tide range at Astoria?
Mean range at Astoria is about 2.4 metres, climbing past 2.9 metres on spring tides and dropping near 1.6 on neaps. The river-mouth amplifies the open-Pacific signal modestly; further inland up the Columbia toward Vancouver and Portland the range damps significantly as the river takes over from the tide.
Where do these tide predictions come from?
NOAA CO-OPS station 9439040 at Tongue Point, just east of Astoria. NOAA's harmonic predictions resolve both the astronomical tide and the long-period river-cycle component. Accuracy is navigation-grade under normal weather. The Columbia Bar's pilots maintain their own real-time current and surge information for ship traffic, which is the authoritative source for crossing decisions.
When are the lowest lows for the Trestle Bay flats?
The lowest lows — minus tides below MLLW — cluster around new and full moons, especially late autumn through early spring. The 7-day table flags each day's lowest predicted tide. Trestle Bay and the broader Lewis and Clark NWR flats open up best at the bottom of these cycles, exposing mudflats that hold dunlin, plovers, and the occasional sandhill crane in passage.
Is this safe to use for navigation?
No. The Columbia Bar is one of the most heavily piloted ship channels in North America for a reason. For any small-craft transit of the bar use the Coast Guard's bar restrictions, NOAA's authoritative chart products, and the latest pilot-station information. The breaking water on a strong ebb against incoming Pacific swell is real and lethal; this site is a planning tool, not a crossing decision.
30-day tide table — Astoria (Columbia River), OR
Heights relative to MLLW. Predictions: NOAA CO-OPS station 9439040 — heights relative to MLLW.
| Day | Type | Time | Height |
|---|---|---|---|
| Sat 25 Jul | Low | 17:11 | 1.1m / 3.5ft |
| High | 23:06 | 2.4m / 8.0ft | |
| Sun 26 Jul | Low | 06:34 | -0.1m / -0.3ft |
| High | 13:04 | 2.0m / 6.5ft | |
| Low | 18:05 | 1.0m / 3.4ft | |
| High | 23:54 | 2.5m / 8.1ft | |
| Mon 27 Jul | Low | 07:16 | -0.2m / -0.6ft |
| High | 13:46 | 2.1m / 6.8ft | |
| Low | 18:54 | 1.0m / 3.1ft | |
| Tue 28 Jul | High | 00:39 | 2.5m / 8.2ft |
| Low | 07:54 | -0.2m / -0.8ft | |
| High | 14:23 | 2.1m / 7.0ft | |
| Low | 19:39 | 0.9m / 2.9ft | |
| Wed 29 Jul | High | 01:20 | 2.5m / 8.3ft |
| Low | 08:29 | -0.3m / -0.9ft | |
| High | 14:57 | 2.2m / 7.1ft | |
| Low | 20:21 | 0.8m / 2.5ft | |
| Thu 30 Jul | High | 02:00 | 2.5m / 8.3ft |
| Low | 09:00 | -0.3m / -1.0ft | |
| High | 15:27 | 2.2m / 7.2ft | |
| Low | 21:00 | 0.7m / 2.2ft | |
| Fri 31 Jul | High | 02:38 | 2.5m / 8.2ft |
| Low | 09:30 | -0.3m / -0.9ft | |
| High | 15:55 | 2.3m / 7.4ft | |
| Low | 21:39 | 0.5m / 1.8ft | |
| Sat 01 Aug | High | 03:18 | 2.4m / 8.0ft |
| Low | 09:58 | -0.2m / -0.7ft | |
| High | 16:21 | 2.3m / 7.6ft | |
| Low | 22:17 | 0.4m / 1.4ft | |
| Sun 02 Aug | High | 04:00 | 2.3m / 7.7ft |
| Low | 10:26 | -0.1m / -0.4ft | |
| High | 16:48 | 2.4m / 7.8ft | |
| Low | 22:58 | 0.3m / 1.1ft | |
| Mon 03 Aug | High | 04:46 | 2.2m / 7.2ft |
| Low | 10:56 | 0.1m / 0.2ft | |
| High | 17:17 | 2.5m / 8.1ft | |
| Low | 23:43 | 0.3m / 0.9ft | |
| Tue 04 Aug | High | 05:39 | 2.0m / 6.6ft |
| Low | 11:30 | 0.3m / 0.9ft | |
| High | 17:52 | 2.5m / 8.3ft | |
| Wed 05 Aug | Low | 00:38 | 0.2m / 0.7ft |
| High | 06:44 | 1.8m / 6.0ft | |
| Low | 12:11 | 0.5m / 1.7ft | |
| High | 18:34 | 2.6m / 8.5ft | |
| Thu 06 Aug | Low | 01:46 | 0.2m / 0.6ft |
| High | 08:04 | 1.7m / 5.5ft | |
| Low | 13:05 | 0.8m / 2.5ft | |
| High | 19:28 | 2.6m / 8.5ft | |
| Fri 07 Aug | Low | 03:05 | 0.1m / 0.3ft |
| High | 09:34 | 1.7m / 5.4ft | |
| Low | 14:17 | 0.9m / 3.1ft | |
| High | 20:34 | 2.6m / 8.5ft | |
| Sat 08 Aug | Low | 04:23 | -0.0m / -0.1ft |
| High | 10:56 | 1.8m / 5.7ft | |
| Low | 15:42 | 1.0m / 3.4ft | |
| High | 21:47 | 2.6m / 8.6ft | |
| Sun 09 Aug | Low | 05:31 | -0.2m / -0.7ft |
| High | 12:02 | 1.9m / 6.3ft | |
| Low | 17:00 | 1.0m / 3.2ft | |
| High | 22:58 | 2.7m / 8.8ft | |
| Mon 10 Aug | Low | 06:29 | -0.4m / -1.2ft |
| High | 12:55 | 2.1m / 6.8ft | |
| Low | 18:07 | 0.8m / 2.7ft | |
| Tue 11 Aug | High | 00:03 | 2.8m / 9.1ft |
| Low | 07:20 | -0.5m / -1.6ft | |
| High | 13:42 | 2.2m / 7.3ft | |
| Low | 19:07 | 0.6m / 2.1ft | |
| Wed 12 Aug | High | 01:00 | 2.8m / 9.2ft |
| Low | 08:05 | -0.5m / -1.8ft | |
| High | 14:24 | 2.3m / 7.7ft | |
| Low | 20:01 | 0.5m / 1.5ft | |
| Thu 13 Aug | High | 01:54 | 2.8m / 9.1ft |
| Low | 08:47 | -0.5m / -1.7ft | |
| High | 15:03 | 2.4m / 8.0ft | |
| Low | 20:52 | 0.3m / 1.0ft | |
| Fri 14 Aug | High | 02:44 | 2.7m / 8.7ft |
| Low | 09:25 | -0.4m / -1.3ft | |
| High | 15:41 | 2.5m / 8.2ft | |
| Low | 21:40 | 0.2m / 0.6ft | |
| Sat 15 Aug | High | 03:33 | 2.5m / 8.3ft |
| Low | 10:01 | -0.2m / -0.8ft | |
| High | 16:16 | 2.5m / 8.3ft | |
| Low | 22:26 | 0.1m / 0.3ft | |
| Sun 16 Aug | High | 04:21 | 2.3m / 7.6ft |
| Low | 10:35 | -0.0m / -0.1ft | |
| High | 16:50 | 2.5m / 8.3ft | |
| Low | 23:12 | 0.1m / 0.3ft | |
| Mon 17 Aug | High | 05:12 | 2.1m / 6.9ft |
| Low | 11:08 | 0.2m / 0.7ft | |
| High | 17:23 | 2.5m / 8.2ft | |
| Low | 23:59 | 0.1m / 0.4ft | |
| Tue 18 Aug | High | 06:06 | 1.9m / 6.3ft |
| Low | 11:42 | 0.5m / 1.6ft | |
| High | 17:57 | 2.4m / 8.0ft | |
| Wed 19 Aug | Low | 00:52 | 0.2m / 0.6ft |
| High | 07:09 | 1.7m / 5.7ft | |
| Low | 12:22 | 0.7m / 2.4ft | |
| High | 18:37 | 2.3m / 7.7ft | |
| Thu 20 Aug | Low | 01:54 | 0.3m / 0.9ft |
| High | 08:22 | 1.6m / 5.4ft | |
| Low | 13:15 | 1.0m / 3.1ft | |
| High | 19:25 | 2.3m / 7.4ft | |
| Fri 21 Aug | Low | 03:05 | 0.3m / 0.9ft |
| High | 09:41 | 1.6m / 5.4ft | |
| Low | 14:26 | 1.1m / 3.6ft | |
| High | 20:26 | 2.2m / 7.2ft | |
| Sat 22 Aug | Low | 04:16 | 0.2m / 0.7ft |
| High | 10:53 | 1.7m / 5.7ft | |
| Low | 15:43 | 1.1m / 3.7ft | |
| High | 21:35 | 2.2m / 7.2ft | |
| Sun 23 Aug | Low | 05:15 | 0.1m / 0.4ft |
| High | 11:50 | 1.9m / 6.1ft | |
| Low | 16:50 | 1.0m / 3.4ft | |
| High | 22:40 | 2.2m / 7.4ft |