Panama City, FL tide times
Panama City, FL tide forecast — heights relative to MLLW.
Today's tide times for Panama City, FL
Tide times at Panama City, FL on Sunday, 26 July 2026: first high tide at 08:02am, first low tide at 07:18pm. Sunrise 05:57am, sunset 07:40pm.
Tide chart for Panama City, FL
24-hour cosine-interpolated curve around the present moment. Heights relative to MLLW. Predictions: NOAA CO-OPS station 8729108.
Sun, moon and conditions on Sun 26 Jul
Snapshot at build time — refreshes daily. Sea state from NOAA harmonic predictions.
Highs and lows next 7 days
Every predicted high and low for the next week, with the daily tidal coefficient (0–120; higher = bigger swing, > 95 means stronger currents).
Other spots nearby
The three closest curated TideTurtle locations to Panama City, FL, measured by great-circle distance.
Today's solunar windows
Solunar tradition: major periods are the ≈3h windows around moon transit and opposition; minor are ≈2h around moonrise and moonset. Pair with the local tide stage and wind for the best read.
Cycle dates near Panama City, FL
Next spring tide on Sun 26 Jul (range 0.6m / 1.9ft). Next neap on Sun 02 Aug.
Spring tides cluster around new and full moons (biggest swings). Neap tides land on quarter moons (smallest swings). See the spring tide and neap tide glossary entries for the why.
About tides at Panama City, FL
A short guide to the coastline at Panama City, FL — geography, sea state, and what the tide is actually doing under your feet.
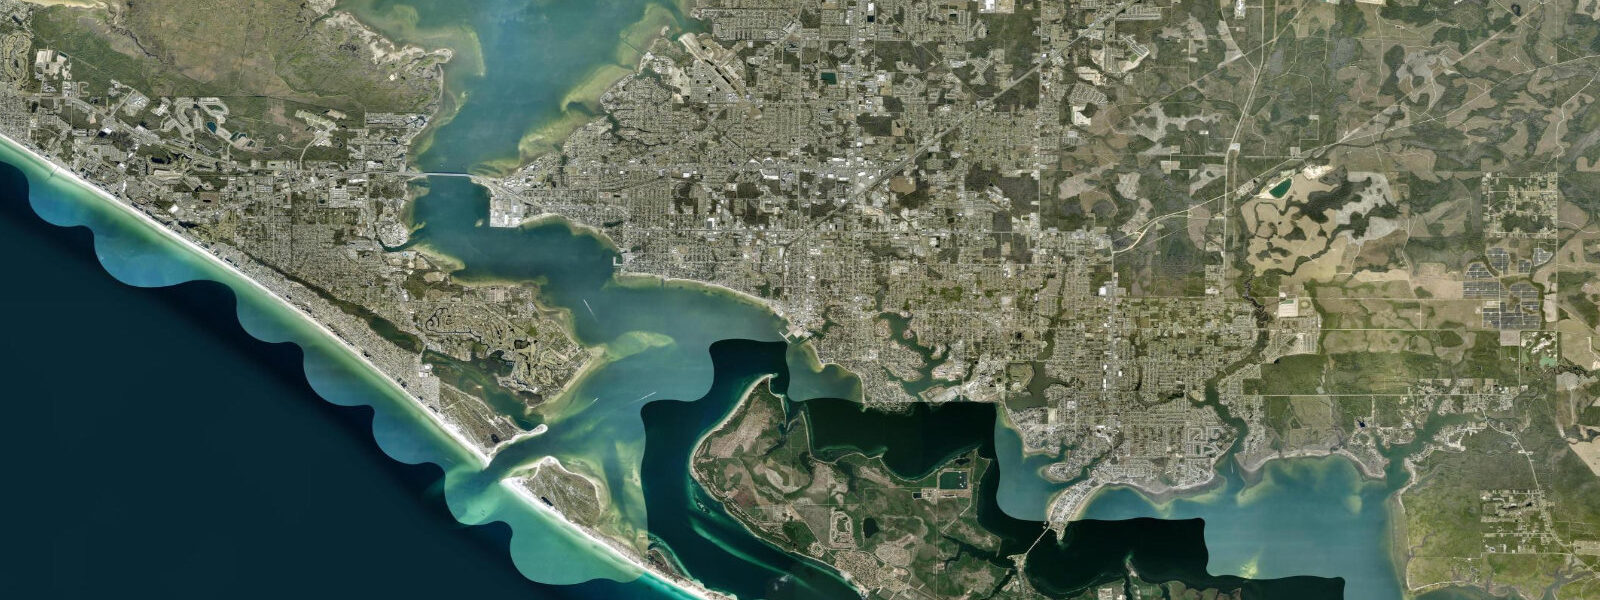
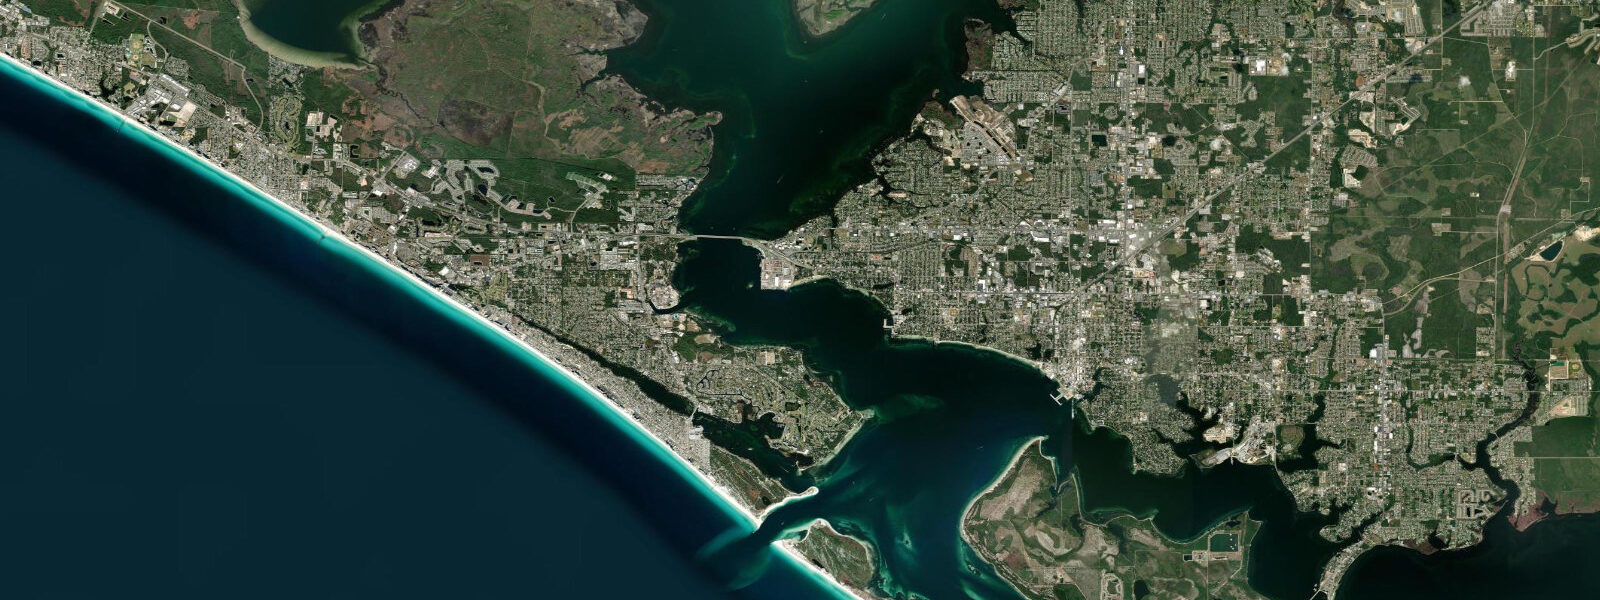
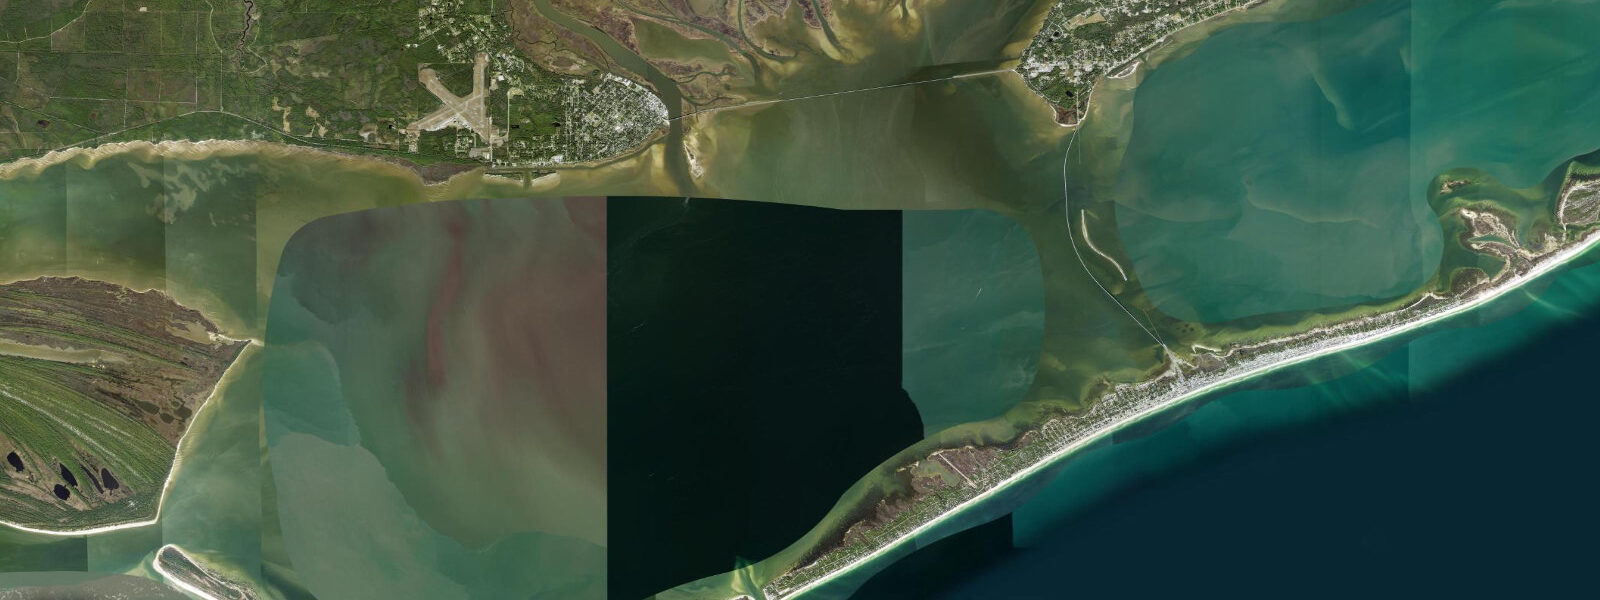
Panama City sits on the Florida Panhandle, the narrow strip of Gulf coast between Pensacola and Apalachicola, and the tide here runs the classic Gulf of Mexico signal: small in absolute size and strongly diurnal most days. 4 metres, often less, and most days produce one clear high and one clear low spaced roughly twenty-four hours apart. A weaker secondary cycle shows up around the moon's quarter phases and produces a brief mixed-semidiurnal stretch each fortnight.
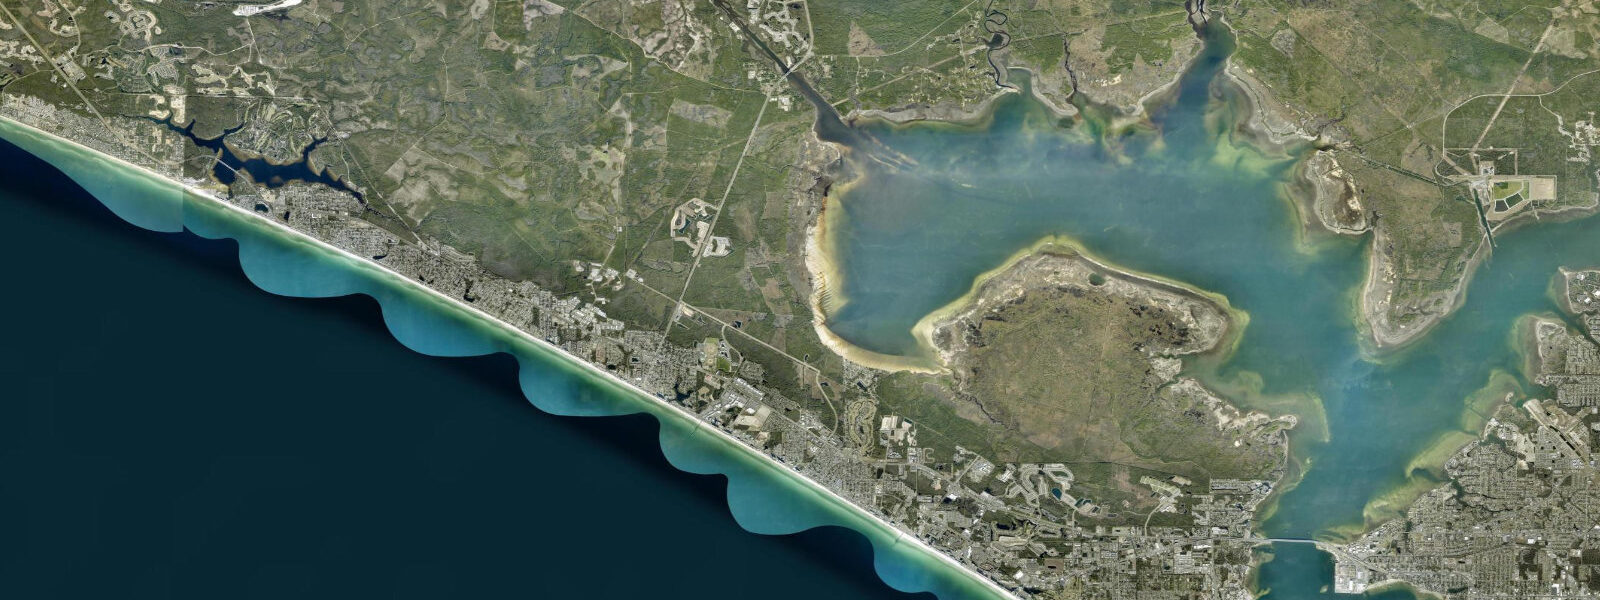
The pass between the bay and the Gulf — St Andrew Pass at the foot of Shell Island — concentrates the flow. Currents at the pass run harder than the height swing implies, especially on the ebb. The wide white-quartz beaches along Front Beach Road change width modestly across each cycle, the swing more visible at the bay-side flats off Tyndall and the inland sound.
Predictions on this page come from NOAA CO-OPS station 8729108. Hurricane season runs June through November and storm surge during a Gulf landfall can override the harmonic signal entirely; the National Hurricane Center is the authoritative real-time source.
Tide questions about Panama City, FL
Quick answers to the most common questions about tide times, range, and water access at Panama City, FL.
When is the next high tide at Panama City?
The hero block shows the next high tide at the St Andrew Bay gauge in local Central time. The 7-day table covers all daily extremes. Some days will show only one high and one low — that is normal Gulf-of-Mexico behaviour, not a missing data point.
Why is the tide range so small in Panama City?
The Gulf of Mexico is a partly enclosed basin and the astronomical forcing at this latitude doesn't have the open-ocean amplification that the East Coast benefits from. Mean range across most of the Florida Panhandle is around 0.4 metres, climbing only modestly on spring tides. The tide signature is also strongly diurnal — one high and one low per day rather than two — most of the lunar month.
Where do these tide predictions come from?
NOAA CO-OPS station 8729108 in St Andrew Bay. NOAA's harmonic predictions are calibrated against the gauge record and resolve the strong diurnal constituent that dominates Gulf tides. Accuracy is navigation-grade under normal weather. The smaller absolute range means storm surge can be proportionally very large compared to the underlying tide signal.
When does the bay-side flat at Shell Island open up?
The widest exposed flats inside St Andrew Bay open at the bottom of the cycle, with the lowest spring lows clustering around new and full moons. The 7-day table flags each day's low and the time. Sunrise from the sun/moon block helps for early bird-and-shorebird visits when the flats are calmest.
Is this safe to use for navigation?
No. For piloting through St Andrew Pass or any of the Gulf passes use NOAA's authoritative chart products and the latest USCG notices. The pass currents run harder than the modest height swing implies, and shoaling in the bay shifts faster than predictions can capture.
30-day tide table — Panama City, FL
Heights relative to MLLW. Predictions: NOAA CO-OPS station 8729108 — heights relative to MLLW.
| Day | Type | Time | Height |
|---|---|---|---|
| Sun 26 Jul | High | 08:02 | 0.5m / 1.8ft |
| Low | 19:18 | -0.0m / -0.1ft | |
| Mon 27 Jul | High | 08:55 | 0.5m / 1.8ft |
| Low | 19:54 | -0.0m / -0.0ft | |
| Tue 28 Jul | High | 09:41 | 0.6m / 1.8ft |
| Low | 20:24 | -0.0m / -0.0ft | |
| Wed 29 Jul | High | 10:23 | 0.5m / 1.8ft |
| Low | 20:45 | 0.0m / 0.1ft | |
| Thu 30 Jul | High | 11:02 | 0.5m / 1.7ft |
| Low | 20:53 | 0.1m / 0.2ft | |
| Fri 31 Jul | High | 11:40 | 0.5m / 1.6ft |
| Low | 20:53 | 0.1m / 0.3ft | |
| Sat 01 Aug | High | 12:20 | 0.4m / 1.4ft |
| Low | 20:49 | 0.2m / 0.5ft | |
| Sun 02 Aug | High | 03:27 | 0.3m / 0.9ft |
| Low | 05:51 | 0.3m / 0.8ft | |
| High | 13:03 | 0.4m / 1.2ft | |
| Low | 20:19 | 0.2m / 0.7ft | |
| Mon 03 Aug | High | 03:10 | 0.3m / 1.0ft |
| Low | 08:29 | 0.2m / 0.8ft | |
| High | 13:52 | 0.3m / 1.0ft | |
| Low | 19:16 | 0.2m / 0.8ft | |
| Tue 04 Aug | High | 02:44 | 0.4m / 1.2ft |
| Low | 11:22 | 0.2m / 0.7ft | |
| Wed 05 Aug | High | 02:47 | 0.4m / 1.4ft |
| Low | 15:08 | 0.1m / 0.4ft | |
| Thu 06 Aug | High | 03:24 | 0.5m / 1.7ft |
| Low | 15:59 | 0.0m / 0.2ft | |
| Fri 07 Aug | High | 04:23 | 0.6m / 1.8ft |
| Low | 16:50 | -0.0m / -0.1ft | |
| Sat 08 Aug | High | 05:43 | 0.6m / 1.9ft |
| Low | 17:41 | -0.1m / -0.2ft | |
| Sun 09 Aug | High | 07:12 | 0.6m / 2.1ft |
| Low | 18:31 | -0.1m / -0.3ft | |
| Mon 10 Aug | High | 08:29 | 0.6m / 2.1ft |
| Low | 19:21 | -0.1m / -0.2ft | |
| Tue 11 Aug | High | 09:38 | 0.6m / 2.1ft |
| Low | 20:08 | -0.0m / -0.1ft | |
| Wed 12 Aug | High | 10:43 | 0.6m / 2.0ft |
| Low | 20:50 | 0.0m / 0.1ft | |
| Thu 13 Aug | High | 11:46 | 0.5m / 1.8ft |
| Low | 21:19 | 0.1m / 0.4ft | |
| Fri 14 Aug | High | 12:48 | 0.5m / 1.5ft |
| Low | 20:47 | 0.2m / 0.7ft | |
| Sat 15 Aug | High | 02:08 | 0.3m / 0.9ft |
| Low | 05:43 | 0.2m / 0.8ft | |
| High | 13:51 | 0.4m / 1.3ft | |
| Low | 19:49 | 0.3m / 0.9ft | |
| Sun 16 Aug | High | 01:56 | 0.3m / 1.1ft |
| Low | 08:10 | 0.2m / 0.7ft | |
| High | 15:06 | 0.3m / 1.0ft | |
| Low | 18:11 | 0.3m / 0.9ft | |
| Mon 17 Aug | High | 01:38 | 0.4m / 1.3ft |
| Low | 10:19 | 0.2m / 0.6ft | |
| Tue 18 Aug | High | 01:38 | 0.5m / 1.5ft |
| Low | 13:31 | 0.2m / 0.5ft | |
| Wed 19 Aug | High | 02:07 | 0.5m / 1.6ft |
| Low | 14:54 | 0.1m / 0.4ft | |
| Thu 20 Aug | High | 02:51 | 0.5m / 1.7ft |
| Low | 15:52 | 0.1m / 0.3ft | |
| Fri 21 Aug | High | 03:48 | 0.5m / 1.7ft |
| Low | 16:40 | 0.1m / 0.2ft | |
| Sat 22 Aug | High | 05:08 | 0.5m / 1.8ft |
| Low | 17:23 | 0.1m / 0.2ft | |
| Sun 23 Aug | High | 06:44 | 0.5m / 1.8ft |
| Low | 18:02 | 0.1m / 0.2ft | |
| Mon 24 Aug | High | 07:54 | 0.6m / 1.8ft |
| Low | 18:36 | 0.1m / 0.2ft |