Auckland (Waitematā) tide times
Auckland (Waitematā) tide forecast — heights relative to MSL.
Tide chart for Auckland (Waitematā)
24-hour cosine-interpolated curve around the present moment. Heights relative to MSL. Predictions: Predictions: Open-Meteo Marine (MeteoFrance SMOC, 0.08° grid).
Sun, moon and conditions on Tue 28 Jul
Snapshot at build time — refreshes daily. Sea state from Open-Meteo Marine.
Highs and lows next 7 days
Every predicted high and low for the next week, with the daily tidal coefficient (0–120; higher = bigger swing, > 95 means stronger currents).
Other spots nearby
The three closest curated TideTurtle locations to Auckland (Waitematā), measured by great-circle distance.
Today's solunar windows
Solunar tradition: major periods are the ≈3h windows around moon transit and opposition; minor are ≈2h around moonrise and moonset. Pair with the local tide stage and wind for the best read.
Cycle dates near Auckland (Waitematā)
Next spring tide on Sat 01 Aug (range 2.2m). Last neap on Sun 26 Jul.
Spring tides cluster around new and full moons (biggest swings). Neap tides land on quarter moons (smallest swings). See the spring tide and neap tide glossary entries for the why.
About tides at Auckland (Waitematā)
A short guide to the coastline at Auckland (Waitematā) — geography, sea state, and what the tide is actually doing under your feet.
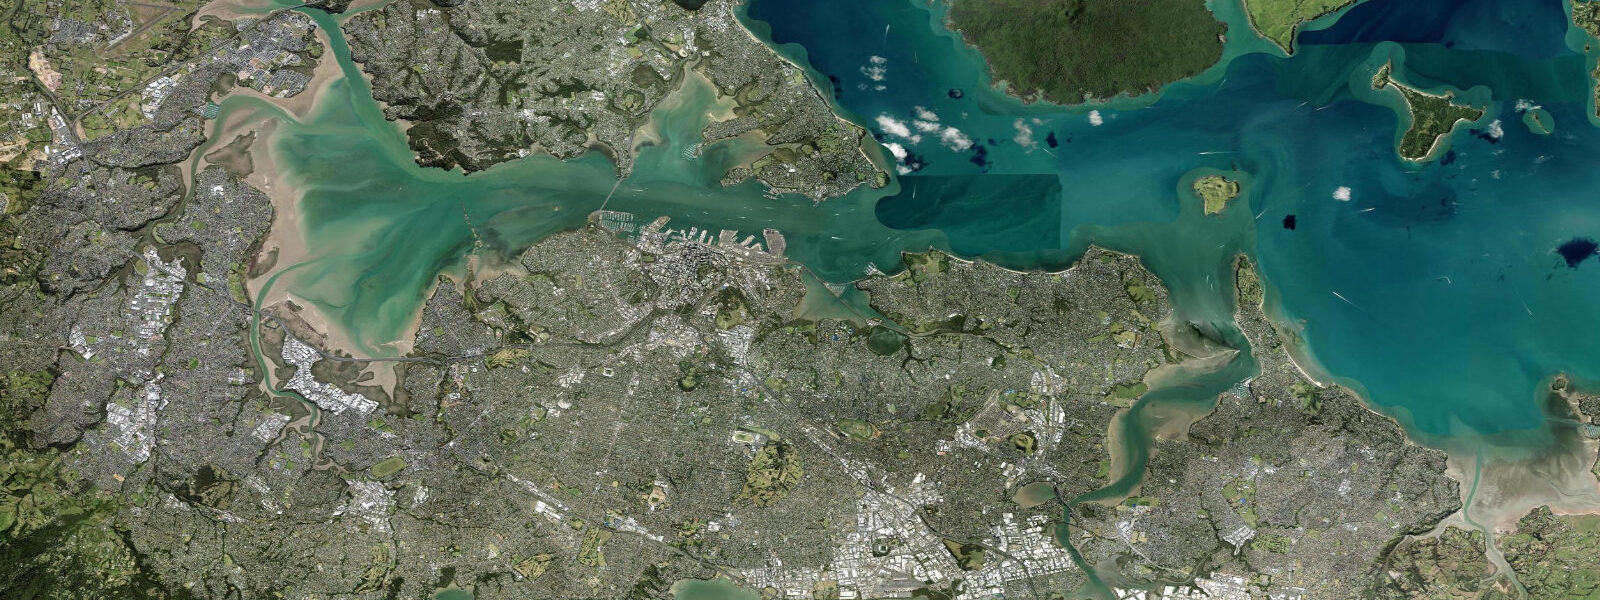
Auckland sits on a narrow isthmus on the upper North Island of New Zealand, with two harbours pressing in from opposite sides — the Waitematā opening east into the Hauraki Gulf and the open Pacific, and the Manukau opening west into the Tasman Sea. That geography means the city has a tide on each side of itself, with different timing and slightly different range. 6 on neaps.
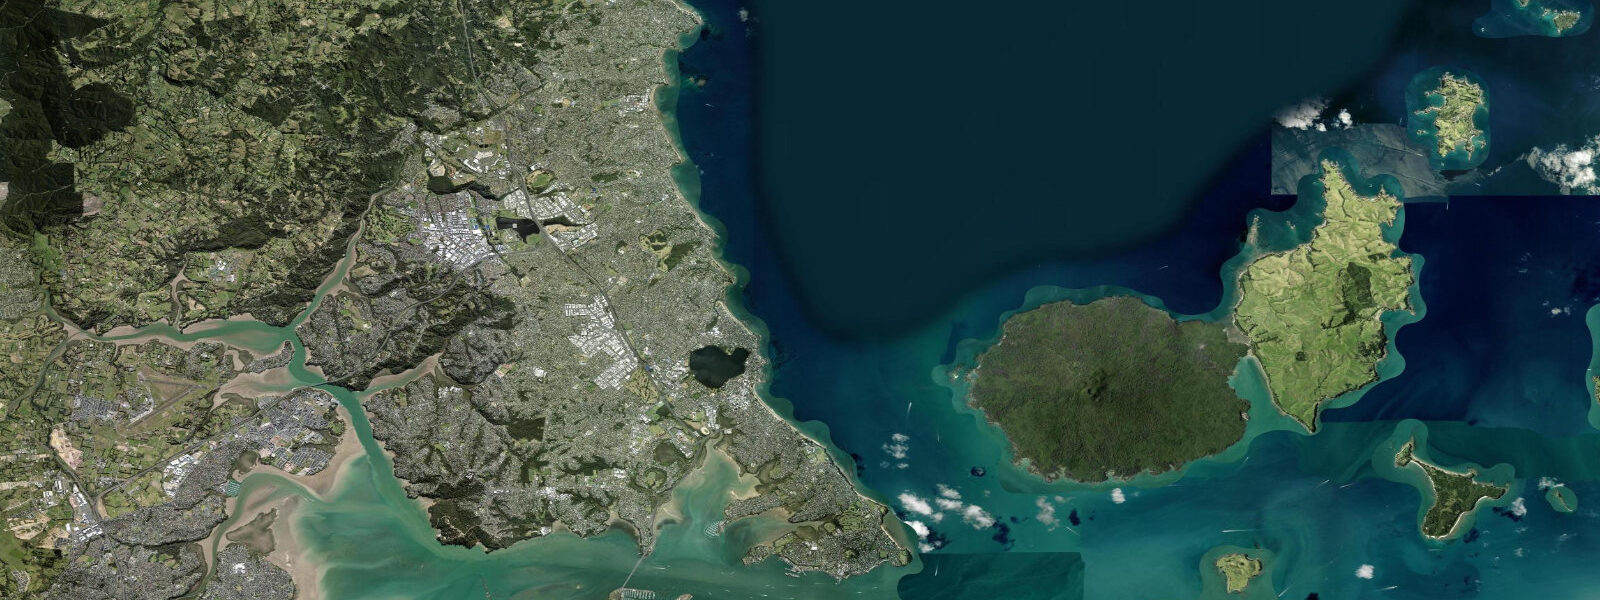
The Manukau on the west side runs a similar pattern but with high water reaching it about three hours later than the Waitematā, because the Tasman tide propagates around the top of the North Island via Cape Reinga. That east-vs-west offset is part of the local navigation lore for the harbour pilots and the Devonport, Half Moon Bay, and Waiheke ferry skippers. The Hauraki Gulf is dotted with islands — Rangitoto, Waiheke, Great Barrier, Little Barrier — and the tide changes the day for kayakers crossing to Rangitoto, snorkellers at Goat Island marine reserve up the coast, fishers on the Coromandel side, yacht crews leaving the Viaduct Basin for the gulf, and walkers on the Browns Bay and Cheltenham foreshore tidal flats.
Lowest spring lows around new and full moons open the rocky intertidal at Long Bay Regional Park and Cheltenham Beach for hours either side. Open-Meteo Marine drives the gridded predictions on this page; for authoritative New Zealand tide data, Land Information New Zealand (LINZ) publishes the official tide tables and operates the reference gauge network.
Tide questions about Auckland (Waitematā)
Quick answers to the most common questions about tide times, range, and water access at Auckland (Waitematā).
When is the next high tide at Auckland?
The hero block shows the next high tide on the Waitematā Harbour at Auckland in local New Zealand time (NZST in winter, NZDT in summer). The 7-day table covers all the highs and lows. High water on the Manukau side reaches the western harbour about three hours later than the Waitematā, so plan accordingly if you're crossing the isthmus.
What's the typical tide range at Auckland?
Mean range at the Waitematā gauge is about 2.5 metres, climbing past 3.2 metres on spring tides around new and full moons and dropping near 1.6 metres on neaps. The pattern is cleanly semidiurnal — two highs and two lows of comparable size each day, twelve and a half hours apart. The Manukau on the western side runs a similar range but with the timing offset by about three hours.
Why does Auckland have two different tides?
Auckland sits on a narrow isthmus between the Waitematā Harbour (east, opening to the Hauraki Gulf and the Pacific) and the Manukau Harbour (west, opening to the Tasman Sea). The Pacific tide reaches the Waitematā directly, while the Tasman tide has to propagate around the top of the North Island past Cape Reinga before reaching the Manukau, so high water on the western side arrives about three hours later than on the eastern side.
Where do these tide predictions come from?
Open-Meteo Marine, a gridded global ocean model. Useful for daily planning around the Waitematā, the Hauraki Gulf islands, and the Manukau. For authoritative New Zealand tide data, Land Information New Zealand (LINZ) operates the official Auckland gauge network and publishes the tide tables. The harbour pilots use those for the deep-water container approaches at Ports of Auckland.
Is this safe to use for navigation?
No. For piloting in or out of the Waitematā Harbour, the Manukau bar, or any of the Hauraki Gulf channels use LINZ tide tables, the Maritime New Zealand notices to mariners, and the Ports of Auckland pilotage guidance. The Manukau bar in particular is a working hazard with strong currents and breaking seas in onshore weather.
7-day tide table — Auckland (Waitematā)
Heights relative to MSL. Predictions: Open-Meteo Marine (MeteoFrance SMOC, 0.08° grid) — heights relative to MSL (not chart datum / LAT). Model-derived.
| Day | Type | Time | Height |
|---|---|---|---|
| Tue 28 Jul | High | 04:52 | 1.0m |
| Low | 11:02 | -0.7m | |
| Wed 29 Jul | High | 05:36 | 1.0m |
| Low | 11:50 | -0.7m | |
| High | 18:15 | 1.2m | |
| Thu 30 Jul | Low | 00:21 | -0.5m |
| High | 18:55 | 1.2m | |
| Fri 31 Jul | Low | 01:02 | -0.6m |
| High | 07:05 | 1.1m | |
| Low | 13:12 | -0.8m | |
| High | 19:35 | 1.3m | |
| Sat 01 Aug | Low | 01:44 | -0.7m |
| High | 07:48 | 1.1m | |
| Low | 13:51 | -0.9m | |
| High | 20:09 | 1.3m | |
| Sun 02 Aug | Low | 02:21 | -0.8m |
| High | 08:24 | 1.2m | |
| Low | 14:34 | -0.8m | |
| High | 20:45 | 1.3m | |
| Mon 03 Aug | Low | 03:02 | -0.8m |
| High | 09:02 | 1.1m | |
| Low | 11:00 | 0.7m |