Vancouver, British Columbia tide times
Vancouver, British Columbia tide forecast — heights relative to MSL.
Today's tide times for Vancouver, British Columbia
Tide times at Vancouver, British Columbia on Saturday, 25 July 2026: first low tide at 05:00pm, first high tide at 10:01pm. Sunrise 05:35am, sunset 09:03pm.
Tide chart for Vancouver, British Columbia
24-hour cosine-interpolated curve around the present moment. Heights relative to MSL. Predictions: Predictions: Open-Meteo Marine (MeteoFrance SMOC, 0.08° grid).
Sun, moon and conditions on Sat 25 Jul
Snapshot at build time — refreshes daily. Sea state from Open-Meteo Marine.
Highs and lows next 7 days
Every predicted high and low for the next week, with the daily tidal coefficient (0–120; higher = bigger swing, > 95 means stronger currents).
Other spots nearby
The three closest curated TideTurtle locations to Vancouver, British Columbia, measured by great-circle distance.
Today's solunar windows
Solunar tradition: major periods are the ≈3h windows around moon transit and opposition; minor are ≈2h around moonrise and moonset. Pair with the local tide stage and wind for the best read.
Cycle dates near Vancouver, British Columbia
Next spring tide on Wed 29 Jul (range 4.0m). Last neap on Sat 25 Jul. Next neap on Fri 31 Jul.
Spring tides cluster around new and full moons (biggest swings). Neap tides land on quarter moons (smallest swings). See the spring tide and neap tide glossary entries for the why.
About tides at Vancouver, British Columbia
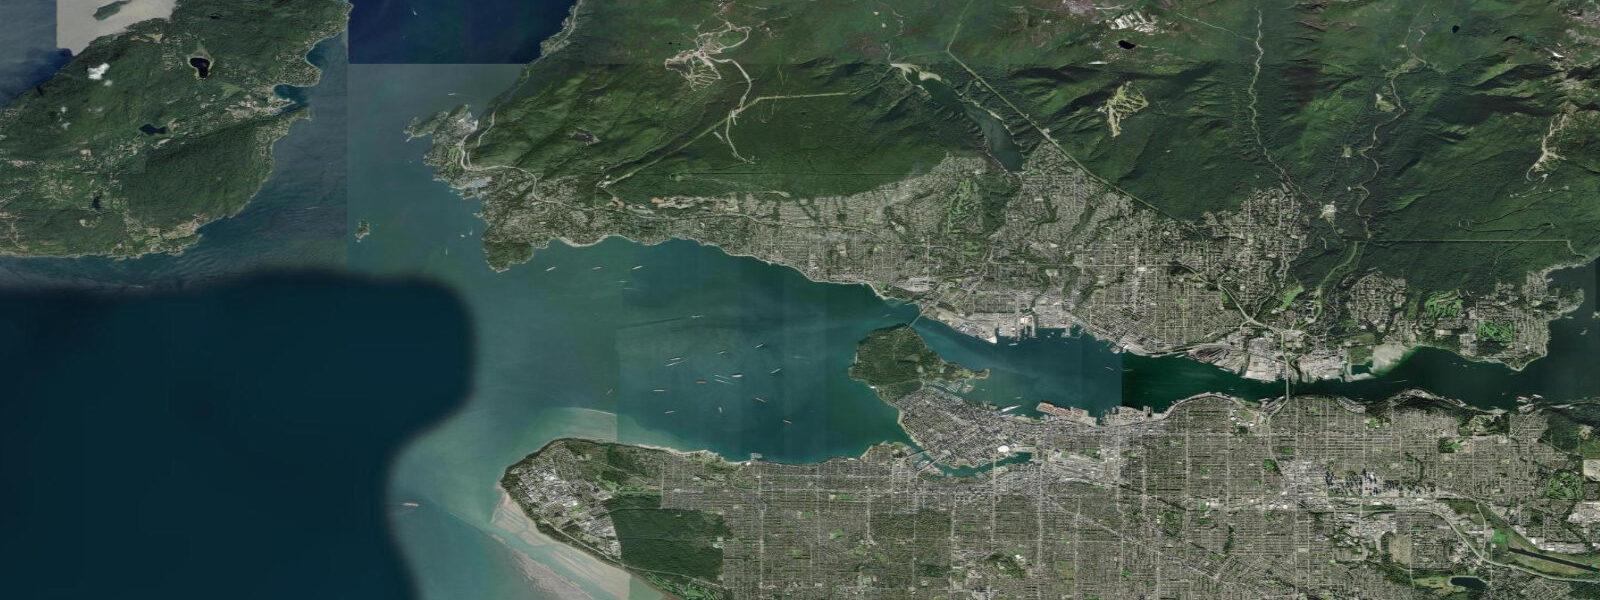
A short guide to the coastline at Vancouver, British Columbia — geography, sea state, and what the tide is actually doing under your feet.
Vancouver sits between the Fraser river delta and the deep glacier-carved fjord of Burrard Inlet on the lower mainland of British Columbia, with the open Pacific reaching it through the Strait of Juan de Fuca and the Strait of Georgia. The tide here is a strongly amplified mixed semidiurnal signal — two highs and two lows of distinctly unequal size each day, with the difference between the higher high and the lower low routinely exceeding the difference between the two highs themselves. 0 on neaps.
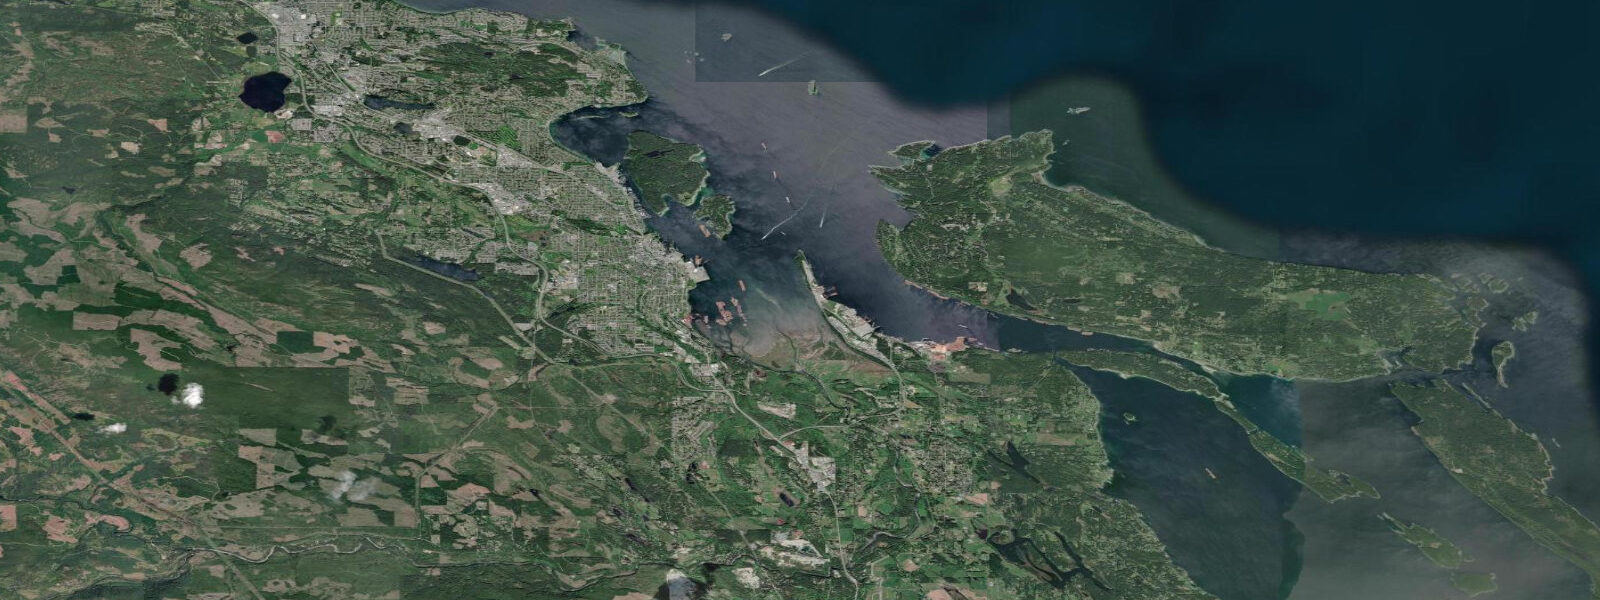
The asymmetric daily swing is the defining feature of the Pacific Canadian coast — the morning low and the evening low can differ by a full metre or more, and the same for the highs, particularly through the summer months when the inequality is most pronounced. The Strait of Georgia funnels the open Pacific signal as it propagates inland from the Strait of Juan de Fuca, and the further north and east you go inside the basin the larger the swing becomes; tidal currents through Seymour Narrows and the Discovery Passage north of Campbell River exceed 15 knots on the spring change of tide and rank among the strongest navigable currents in the world. Stanley Park's intertidal zone at Third Beach, the Lighthouse Park rocks across the inlet at West Vancouver, and the long sand at Spanish Banks, Locarno, and Jericho widen by 30 metres or more at the bottom of the cycle.
Lowest spring lows around new and full moons open the kelp-and-rock intertidal across the inlet at Whytecliff Park for hours either side. The seaplane traffic at Coal Harbour, the SeaBus across to North Vancouver, the working container terminals at Vanterm and Deltaport, and the recreational boat fleet leaving False Creek for the Gulf Islands all read the table for different windows. Open-Meteo Marine drives the gridded predictions on this page; for authoritative Canadian Pacific tide data, the Canadian Hydrographic Service publishes the official tide tables and operates the Point Atkinson and Vancouver Harbour reference gauges.
Tide questions about Vancouver, British Columbia
Quick answers to the most common questions about tide times, range, and water access at Vancouver, British Columbia.
When is the next high tide at Vancouver?
The hero block shows the next high tide at the Burrard Inlet gauge in local Pacific time (PST in winter, PDT in summer). The 7-day table covers all the highs and lows. High water at Point Atkinson at the inlet mouth arrives a few minutes ahead of the inner-harbour gauge; up the inlet at Port Moody it lags by about thirty minutes.
What's the typical tide range at Vancouver?
Mean range at Burrard Inlet is about 3.1 metres, climbing past 4.5 metres on spring tides around new and full moons and dropping near 2.0 metres on neaps. The pattern is strongly mixed semidiurnal — two highs and two lows of distinctly unequal size each day — and the difference between the lower-low and the higher-high on a single day routinely exceeds 4 metres in summer.
Where do these tide predictions come from?
Open-Meteo Marine, a gridded global ocean model. Useful for daily planning around Burrard Inlet, the Stanley Park seawall, the English Bay beaches, and the Howe Sound recreational coastline. For authoritative Canadian Pacific tide data, the Canadian Hydrographic Service publishes the official tide tables and operates the Point Atkinson and Vancouver Harbour reference gauges.
Why are the morning and evening tides so different?
The Pacific Canadian coast runs strongly mixed semidiurnal tides, where the two highs of a day can differ by a metre or more and the two lows by the same. The asymmetry comes from the diurnal component of the astronomical forcing being unusually strong at this latitude relative to the semidiurnal component. The lowest predicted lows of each day cluster around the morning low in summer and the evening low in winter — a useful pattern for tidepoolers and beachcombers reading the calendar months ahead.
Is this safe to use for navigation?
No. For piloting in or out of Burrard Inlet, transiting the Strait of Georgia, or working the Howe Sound and Gulf Islands waters use the Canadian Hydrographic Service authoritative tide tables, the Pacific Pilotage Authority guidance, and the Canadian Coast Guard notices to mariners. Currents through Seymour Narrows up the coast can exceed 15 knots and are among the strongest navigable currents in the world.
8-day tide table — Vancouver, British Columbia
Heights relative to MSL. Predictions: Open-Meteo Marine (MeteoFrance SMOC, 0.08° grid) — heights relative to MSL (not chart datum / LAT). Model-derived.
| Day | Type | Time | Height |
|---|---|---|---|
| Sat 25 Jul | Low | 17:00 | 0.0m |
| High | 22:01 | 1.6m | |
| Sun 26 Jul | Low | 05:14 | -1.5m |
| High | 11:40 | 1.0m | |
| Low | 17:00 | -0.2m | |
| High | 22:46 | 1.7m | |
| Mon 27 Jul | Low | 05:57 | -1.7m |
| High | 12:15 | 1.1m | |
| Low | 17:46 | -0.3m | |
| High | 23:26 | 1.8m | |
| Tue 28 Jul | Low | 06:33 | -1.8m |
| High | 12:47 | 1.2m | |
| Low | 18:25 | -0.4m | |
| Wed 29 Jul | High | 00:02 | 1.9m |
| Low | 07:05 | -2.0m | |
| High | 13:16 | 1.3m | |
| Low | 19:00 | -0.7m | |
| Thu 30 Jul | High | 00:38 | 1.9m |
| Low | 07:35 | -2.1m | |
| High | 13:47 | 1.4m | |
| Low | 19:35 | -0.8m | |
| Fri 31 Jul | High | 01:16 | 1.8m |
| Low | 08:02 | -2.0m | |
| High | 14:17 | 1.5m | |
| Low | 20:10 | -0.9m | |
| Sat 01 Aug | High | 01:55 | 1.8m |
| Low | 08:31 | -1.9m | |
| High | 14:49 | 1.6m |