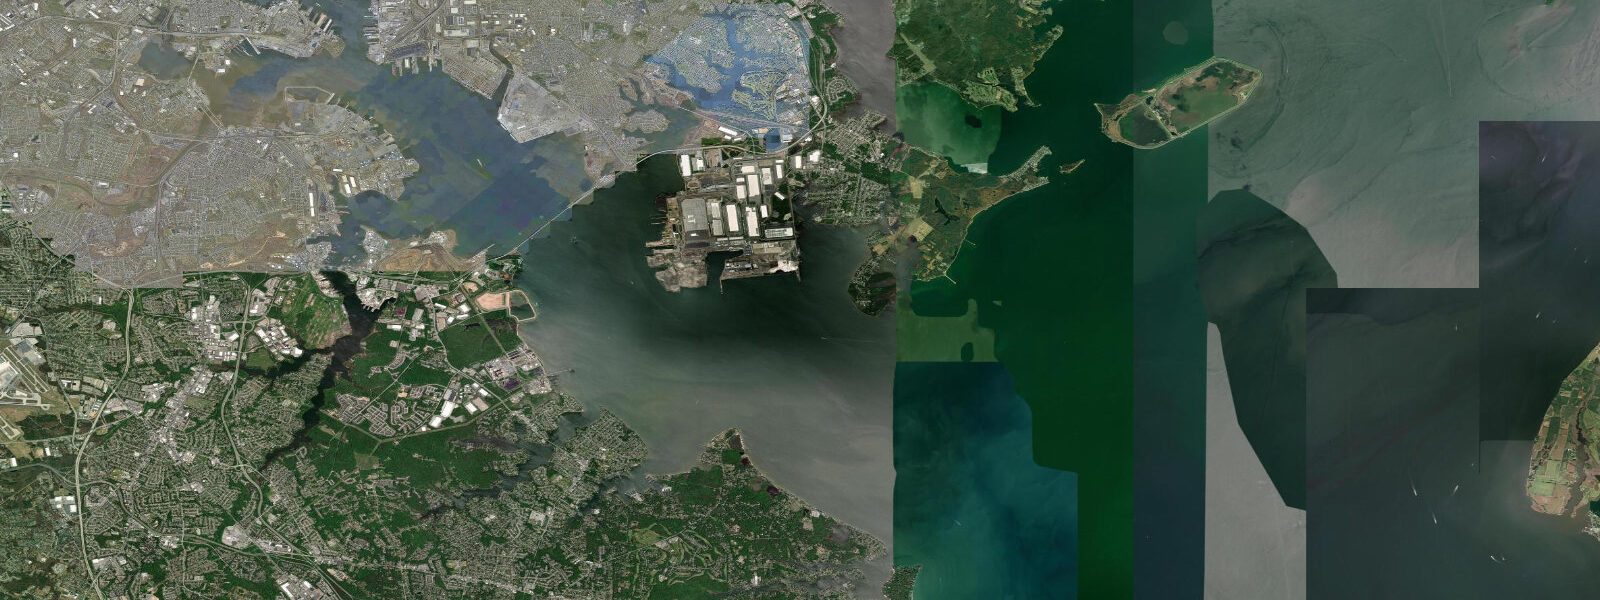
Fort Carroll tide times
Fort Carroll tide forecast — heights relative to MSL.
Today's tide times for Fort Carroll
Tide times at Fort Carroll on Tuesday, 4 August 2026: first high tide at 01:21am, first low tide at 03:10am, second high tide at 04:43am, second low tide at 08:18am, third high tide at 08:40am, third low tide at 11:21am, fourth high tide at 05:47pm, fourth low tide at 07:55pm, 5th high tide at 09:40pm, 5th low tide at 11:36pm. Sunrise 06:09am, sunset 08:15pm.
Tide chart for Fort Carroll
24-hour cosine-interpolated curve around the present moment. Heights relative to MSL. Predictions: Predictions: Open-Meteo Marine (MeteoFrance SMOC, 0.08° grid).
Sun, moon and conditions on Tue 04 Aug
Snapshot at build time — refreshes daily. Sea state from Open-Meteo Marine.
Highs and lows next 7 days
Every predicted high and low for the next week, with the daily tidal coefficient (0–120; higher = bigger swing, > 95 means stronger currents).
Other spots nearby
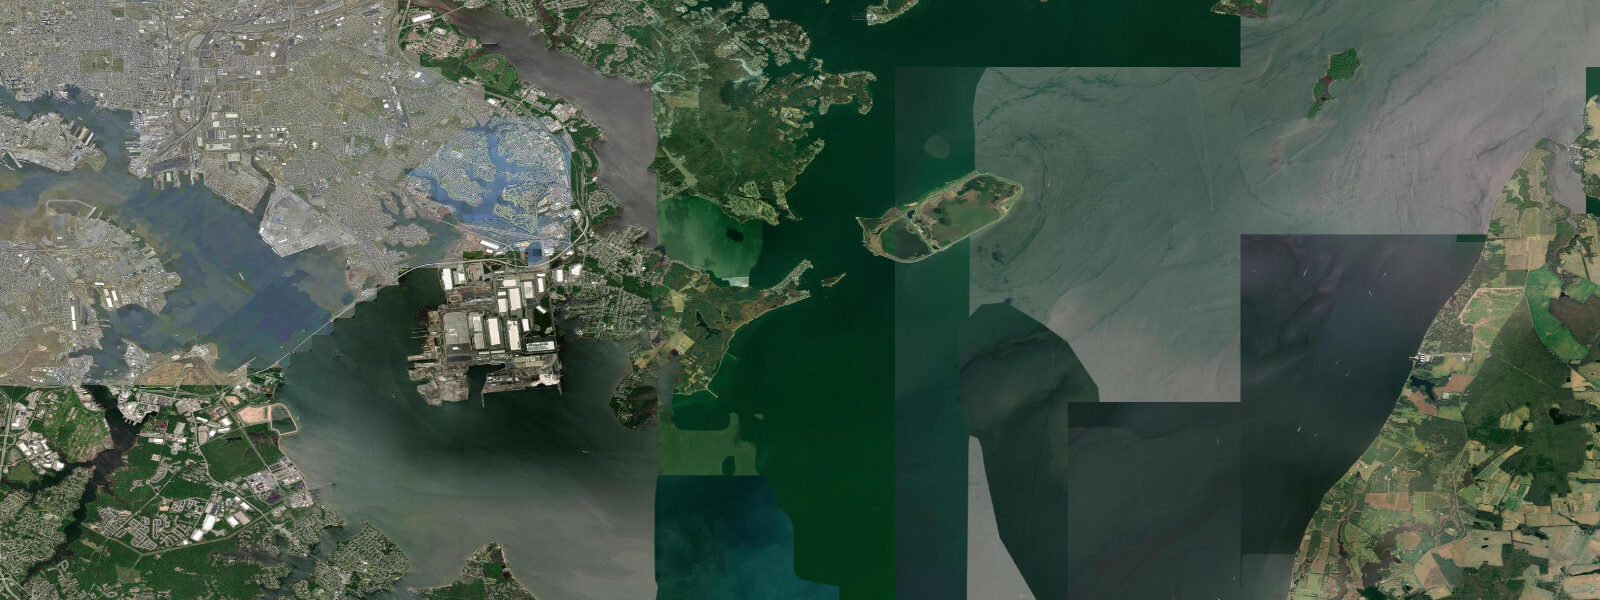
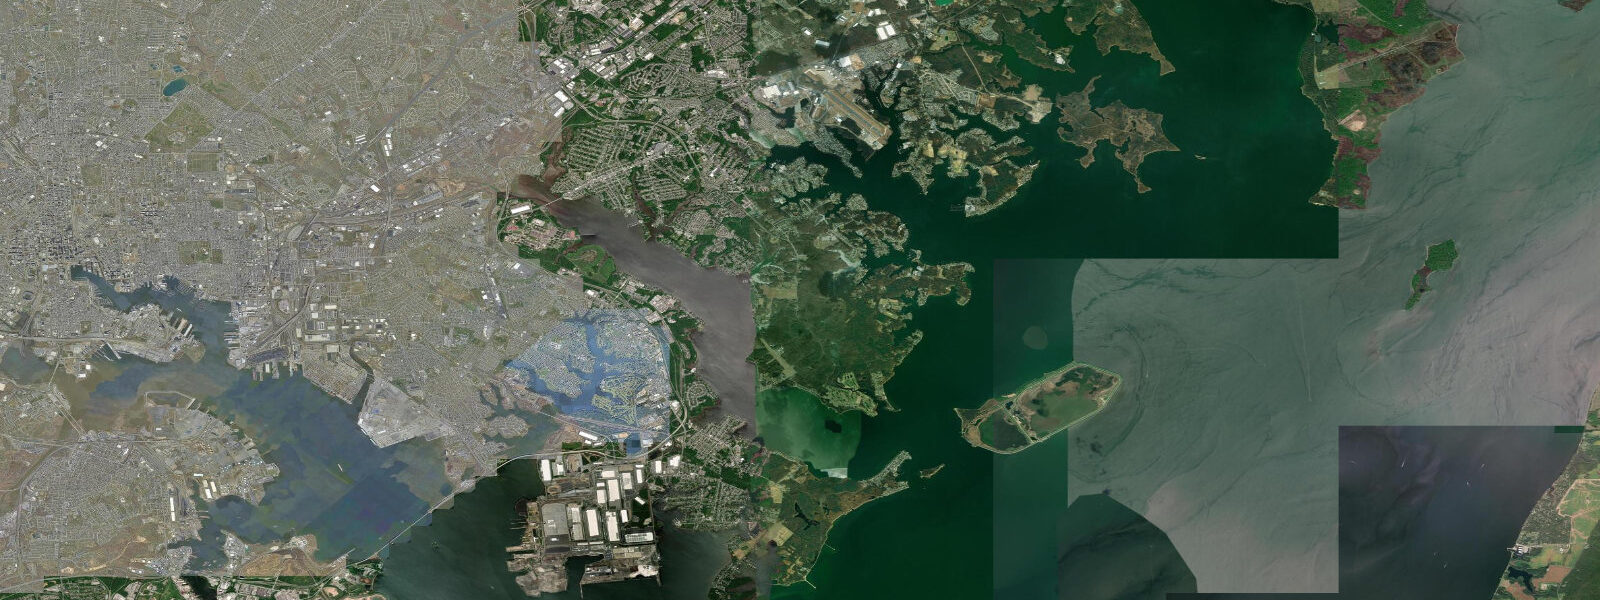
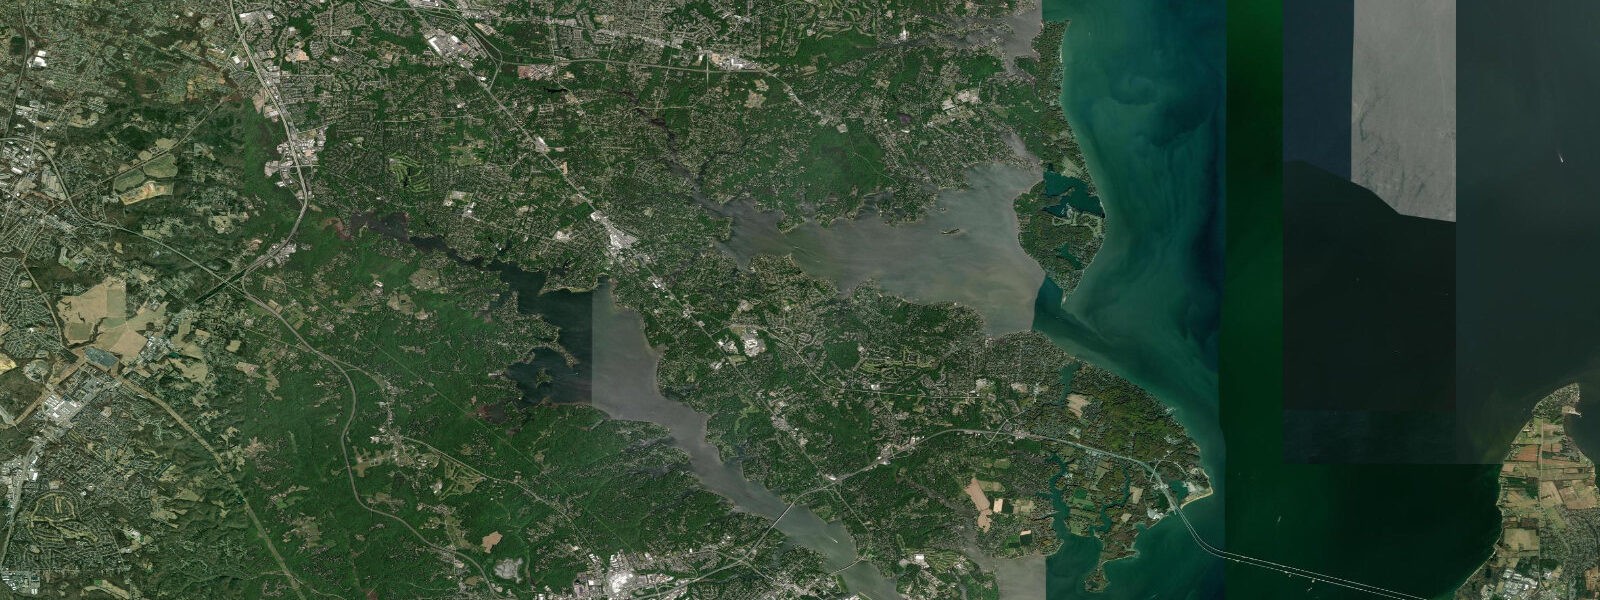
The three closest curated TideTurtle locations to Fort Carroll, measured by great-circle distance.
Today's solunar windows
Solunar tradition: major periods are the ≈3h windows around moon transit and opposition; minor are ≈2h around moonrise and moonset. Pair with the local tide stage and wind for the best read.
Cycle dates near Fort Carroll
Last spring tide on Mon 03 Aug (range 0.3m / 1.1ft). Next neap on Sat 08 Aug.
Spring tides cluster around new and full moons (biggest swings). Neap tides land on quarter moons (smallest swings). See the spring tide and neap tide glossary entries for the why.
About tides at Fort Carroll
A short guide to the coastline at Fort Carroll — geography, sea state, and what the tide is actually doing under your feet.
Fort Carroll sits on the Maryland coast of United States. The local tide pattern is moderate semidiurnal: from the gridded ocean model TideTurtle samples, the seven-day water-level range reaches about 0.7 m, with the bigger swings clustering around new and full moons.
For anyone visiting Fort Carroll — surfers, anglers, paddlers, beach-walkers — the tide chart matters in two ways. First, the time of high or low water decides whether the shoreline is exposed or covered. Second, the rate of rise or fall sets how fast currents move in and out of any inlet, harbour or rivermouth nearby. The page below shows both: the next high and low tide times for today, and the seven-day forecast underneath.
Heights on this page are gridded predictions from the Open-Meteo Marine model, normalised to Mean Sea Level (MSL). They are accurate to within roughly 15-30 cm on most days; on storm-surge days the actual water can run higher than the prediction. For safety-critical planning consult official hydrographic services; for everyday surf, kayak, fishing and walking decisions the chart is enough.
Spring tides — the biggest swings of the lunar cycle — happen around new and full moons (twice a month). Neap tides — the smallest swings — land on the quarter moons. If you want the lowest low tide of the month for tidepooling or sandbar walking at Fort Carroll, look at the seven-day chart for the spring tide.
Tide questions about Fort Carroll
Quick answers to the most common questions about tide times, range, and water access at Fort Carroll.
When is the next high tide at Fort Carroll?
The next high tide time at Fort Carroll updates daily on this page from gridded Open-Meteo Marine predictions. Look at the highlighted next-high-tide chip at the top of the chart.
What is the tidal range at Fort Carroll?
Over the next seven days the modelled water-level range at Fort Carroll is about 0.7 m. Spring tides (around new and full moons) push the range above this average; neap tides (quarter moons) trim it.
Are these tide times accurate for navigation at Fort Carroll?
Open-Meteo Marine is a gridded global model — accurate enough for everyday surf, fishing, paddling and walking decisions, but not a substitute for an official hydrographic chart. Consult united states's national authority before relying on it for safety-critical use.
7-day tide table — Fort Carroll
Heights relative to MSL. Predictions: Open-Meteo Marine (MeteoFrance SMOC, 0.08° grid) — heights relative to MSL (not chart datum / LAT). Model-derived.
| Day | Type | Time | Height |
|---|---|---|---|
| Tue 04 Aug | High | 01:21 | -0.5m / -1.5ft |
| Low | 03:10 | -0.5m / -1.7ft | |
| High | 04:43 | -0.5m / -1.5ft | |
| Low | 08:18 | -0.7m / -2.3ft | |
| High | 08:40 | -0.7m / -2.2ft | |
| Low | 11:21 | -0.8m / -2.6ft | |
| High | 17:47 | -0.5m / -1.6ft | |
| Low | 19:55 | -0.6m / -1.8ft | |
| High | 21:40 | -0.5m / -1.7ft | |
| Low | 23:36 | -0.6m / -1.9ft | |
| Wed 05 Aug | High | 05:56 | -0.3m / -0.9ft |
| Low | 09:00 | -0.4m / -1.3ft | |
| High | 09:40 | -0.4m / -1.3ft | |
| Low | 12:10 | -0.5m / -1.6ft | |
| High | 15:10 | -0.4m / -1.2ft | |
| Low | 15:45 | -0.4m / -1.2ft | |
| High | 18:21 | -0.3m / -0.9ft | |
| Low | 21:18 | -0.4m / -1.4ft | |
| Thu 06 Aug | High | 06:36 | -0.3m / -0.9ft |
| Low | 13:00 | -0.6m / -1.9ft | |
| High | 19:03 | -0.3m / -1.1ft | |
| Low | 22:00 | -0.5m / -1.6ft | |
| High | 23:15 | -0.4m / -1.5ft | |
| Fri 07 Aug | Low | 01:15 | -0.5m / -1.7ft |
| High | 04:15 | -0.3m / -1.1ft | |
| High | 07:06 | -0.3m / -1.1ft | |
| Low | 13:50 | -0.7m / -2.2ft | |
| High | 20:03 | -0.4m / -1.3ft | |
| Sat 08 Aug | Low | 02:04 | -0.5m / -1.7ft |
| High | 05:12 | -0.4m / -1.2ft | |
| High | 08:00 | -0.4m / -1.2ft | |
| Low | 14:42 | -0.6m / -2.0ft | |
| High | 17:23 | -0.5m / -1.5ft | |
| Low | 18:50 | -0.5m / -1.6ft | |
| High | 20:50 | -0.4m / -1.4ft | |
| Low | 23:15 | -0.5m / -1.8ft | |
| Sun 09 Aug | High | 01:04 | -0.5m / -1.6ft |
| Low | 02:52 | -0.5m / -1.8ft | |
| High | 05:54 | -0.4m / -1.2ft | |
| High | 08:50 | -0.4m / -1.2ft | |
| Low | 11:55 | -0.5m / -1.8ft | |
| High | 18:21 | -0.4m / -1.3ft | |
| High | 21:38 | -0.4m / -1.2ft | |
| Mon 10 Aug | Low | 00:03 | -0.5m / -1.6ft |
| High | 02:04 | -0.4m / -1.3ft | |
| Low | 03:52 | -0.5m / -1.5ft | |
| High | 06:23 | -0.3m / -1.1ft | |
| Low | 16:07 | -0.6m / -1.8ft | |
| High | 19:00 | -0.4m / -1.3ft |