Monterey, CA tide times
Monterey, CA tide forecast — heights relative to MLLW.
Today's tide times for Monterey, CA
Tide times at Monterey, CA on Saturday, 25 July 2026: first high tide at 08:18pm. Sunrise 06:08am, sunset 08:20pm.
Tide chart for Monterey, CA
24-hour cosine-interpolated curve around the present moment. Heights relative to MLLW. Predictions: NOAA CO-OPS station 9413450.
Sun, moon and conditions on Sat 25 Jul
Snapshot at build time — refreshes daily. Sea state from NOAA harmonic predictions.
Highs and lows next 7 days
Every predicted high and low for the next week, with the daily tidal coefficient (0–120; higher = bigger swing, > 95 means stronger currents).
Other spots nearby
The three closest curated TideTurtle locations to Monterey, CA, measured by great-circle distance.
Today's solunar windows
Solunar tradition: major periods are the ≈3h windows around moon transit and opposition; minor are ≈2h around moonrise and moonset. Pair with the local tide stage and wind for the best read.
Cycle dates near Monterey, CA
Next spring tide on Tue 28 Jul (range 1.9m / 6.3ft). Last neap on Sat 25 Jul. Next neap on Thu 06 Aug.
Spring tides cluster around new and full moons (biggest swings). Neap tides land on quarter moons (smallest swings). See the spring tide and neap tide glossary entries for the why.
About tides at Monterey, CA
A short guide to the coastline at Monterey, CA — geography, sea state, and what the tide is actually doing under your feet.
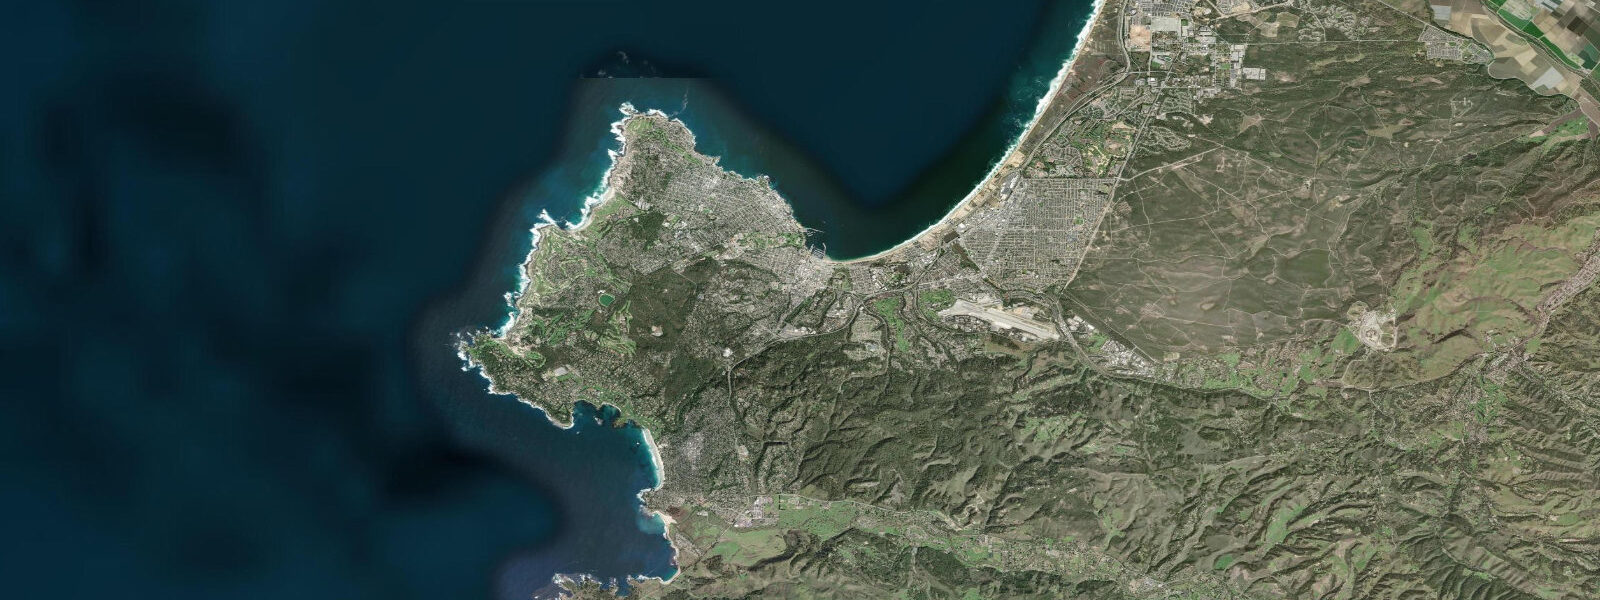
Monterey sits on the south arm of one of the most-photographed bays in California, the deep submarine canyon bringing cold water and cold-water wildlife close to shore. The tide gauge is at Municipal Wharf 2, inside the harbour. 1 metres, mixed semidiurnal — two highs and two lows of unequal size each day, the bigger swing on the lower-low water.
7. The harbour itself stays navigable across the cycle but the inner lagoon shoals at low water, and the kelp forest off Cannery Row breathes with the swing — paddlers reading the table for a flat-water out-and-back time the trip to slack and the early flood. The lowest spring-tide lows of the month open the rocky shelf at Asilomar and Pacific Grove for an hour or so either side of low water, exposing tide pools that stay covered most days.
Predictions on this page come from NOAA CO-OPS station 9413450. Pacific storm surge in winter can lift water levels 10–20 cm above predicted; the harmonic table assumes calm.
Tide questions about Monterey, CA
Quick answers to the most common questions about tide times, range, and water access at Monterey, CA.
When is the next high tide at Monterey?
The hero block shows the next high tide at the Municipal Wharf 2 gauge in local Pacific time. The 7-day table covers all four daily extremes. Monterey Bay's tide signal closely tracks Santa Cruz on the north arm and the open coast at Carmel just south, with phase differences under 15 minutes.
What's the typical tide range at Monterey?
Mean range at Monterey Wharf is about 1.1 metres, the modest open-coast Southern Pacific signal. Spring tides — around new and full moons — push toward 1.5 metres, neaps drop near 0.7 metres. The submarine canyon offshore changes none of that astronomically; it does shape currents and upwelling more than tide curves.
When are the best low tides for tide pooling at Asilomar?
The lowest lows — minus tides below MLLW — cluster around new and full moons, especially in winter. Asilomar's intertidal shelf and the rocky points at Pacific Grove open up best when the predicted low is below 0 metres MLLW. The 7-day table flags each day's lowest predicted tide. Sunrise from the sun/moon block helps with first-light visits when the pools are clearest.
Where do these tide predictions come from?
NOAA CO-OPS station 9413450, Monterey. NOAA harmonic predictions for the Pacific Coast are very high accuracy under normal weather. The submarine canyon offshore doesn't affect the astronomical tide signal — it shapes currents and upwelling, both of which fall outside what tide tables describe.
Is this safe to use for navigation?
No. For piloting in Monterey Bay use NOAA's authoritative chart products and the latest USCG notices. Inshore conditions in the bay — wind chop, swell, and the strong upwelling currents — make harbour entries on big-swell days a real-time judgment call, not a tide-table call.
30-day tide table — Monterey, CA
Heights relative to MLLW. Predictions: NOAA CO-OPS station 9413450 — heights relative to MLLW.
| Day | Type | Time | Height |
|---|---|---|---|
| Sat 25 Jul | High | 20:18 | 1.7m / 5.6ft |
| Sun 26 Jul | Low | 04:01 | -0.1m / -0.2ft |
| High | 11:08 | 1.1m / 3.7ft | |
| Low | 14:44 | 1.0m / 3.1ft | |
| High | 20:58 | 1.7m / 5.7ft | |
| Mon 27 Jul | Low | 04:36 | -0.1m / -0.4ft |
| High | 11:34 | 1.1m / 3.7ft | |
| Low | 15:25 | 0.9m / 3.0ft | |
| High | 21:36 | 1.8m / 5.8ft | |
| Tue 28 Jul | Low | 05:08 | -0.1m / -0.5ft |
| High | 11:59 | 1.2m / 3.8ft | |
| Low | 16:05 | 0.9m / 2.9ft | |
| High | 22:13 | 1.8m / 5.8ft | |
| Wed 29 Jul | Low | 05:39 | -0.2m / -0.5ft |
| High | 12:24 | 1.2m / 3.9ft | |
| Low | 16:45 | 0.8m / 2.7ft | |
| High | 22:48 | 1.8m / 5.8ft | |
| Thu 30 Jul | Low | 06:08 | -0.1m / -0.5ft |
| High | 12:49 | 1.2m / 4.0ft | |
| Low | 17:27 | 0.8m / 2.6ft | |
| High | 23:24 | 1.7m / 5.6ft | |
| Fri 31 Jul | Low | 06:36 | -0.1m / -0.3ft |
| High | 13:15 | 1.3m / 4.2ft | |
| Low | 18:12 | 0.7m / 2.4ft | |
| Sat 01 Aug | High | 00:02 | 1.6m / 5.3ft |
| Low | 07:04 | 0.0m / 0.0ft | |
| High | 13:41 | 1.3m / 4.4ft | |
| Low | 19:02 | 0.7m / 2.3ft | |
| Sun 02 Aug | High | 00:44 | 1.5m / 4.8ft |
| Low | 07:32 | 0.1m / 0.4ft | |
| High | 14:10 | 1.4m / 4.6ft | |
| Low | 19:58 | 0.6m / 2.1ft | |
| Mon 03 Aug | High | 01:34 | 1.3m / 4.3ft |
| Low | 08:01 | 0.3m / 0.9ft | |
| High | 14:41 | 1.5m / 4.9ft | |
| Low | 21:03 | 0.5m / 1.8ft | |
| Tue 04 Aug | High | 02:38 | 1.1m / 3.7ft |
| Low | 08:31 | 0.5m / 1.5ft | |
| High | 15:18 | 1.6m / 5.2ft | |
| Low | 22:18 | 0.4m / 1.4ft | |
| Wed 05 Aug | High | 04:05 | 1.0m / 3.3ft |
| Low | 09:04 | 0.6m / 2.1ft | |
| High | 16:02 | 1.7m / 5.5ft | |
| Low | 23:39 | 0.3m / 1.0ft | |
| Thu 06 Aug | High | 06:00 | 0.9m / 3.0ft |
| Low | 09:48 | 0.8m / 2.5ft | |
| High | 16:55 | 1.8m / 5.7ft | |
| Fri 07 Aug | Low | 00:54 | 0.1m / 0.4ft |
| High | 07:54 | 1.0m / 3.2ft | |
| Low | 10:55 | 0.9m / 2.9ft | |
| High | 17:56 | 1.8m / 6.0ft | |
| Sat 08 Aug | Low | 01:57 | -0.1m / -0.2ft |
| High | 09:07 | 1.1m / 3.4ft | |
| Low | 12:19 | 0.9m / 3.1ft | |
| High | 18:58 | 1.9m / 6.3ft | |
| Sun 09 Aug | Low | 02:52 | -0.2m / -0.7ft |
| High | 09:53 | 1.1m / 3.7ft | |
| Low | 13:36 | 0.9m / 3.0ft | |
| High | 19:59 | 2.0m / 6.5ft | |
| Mon 10 Aug | Low | 03:40 | -0.3m / -1.0ft |
| High | 10:31 | 1.2m / 3.9ft | |
| Low | 14:42 | 0.8m / 2.7ft | |
| High | 20:56 | 2.0m / 6.7ft | |
| Tue 11 Aug | Low | 04:25 | -0.4m / -1.2ft |
| High | 11:06 | 1.3m / 4.2ft | |
| Low | 15:41 | 0.7m / 2.4ft | |
| High | 21:49 | 2.0m / 6.6ft | |
| Wed 12 Aug | Low | 05:07 | -0.3m / -1.1ft |
| High | 11:40 | 1.3m / 4.4ft | |
| Low | 16:37 | 0.6m / 2.1ft | |
| High | 22:40 | 1.9m / 6.4ft | |
| Thu 13 Aug | Low | 05:46 | -0.3m / -0.8ft |
| High | 12:14 | 1.4m / 4.6ft | |
| Low | 17:32 | 0.5m / 1.8ft | |
| High | 23:30 | 1.8m / 6.0ft | |
| Fri 14 Aug | Low | 06:23 | -0.1m / -0.4ft |
| High | 12:49 | 1.5m / 4.9ft | |
| Low | 18:27 | 0.5m / 1.6ft | |
| Sat 15 Aug | High | 00:20 | 1.6m / 5.4ft |
| Low | 06:57 | 0.1m / 0.2ft | |
| High | 13:24 | 1.5m / 5.0ft | |
| Low | 19:23 | 0.4m / 1.4ft | |
| Sun 16 Aug | High | 01:14 | 1.4m / 4.7ft |
| Low | 07:31 | 0.3m / 0.8ft | |
| High | 14:00 | 1.6m / 5.1ft | |
| Low | 20:22 | 0.4m / 1.4ft | |
| Mon 17 Aug | High | 02:13 | 1.2m / 4.1ft |
| Low | 08:03 | 0.5m / 1.5ft | |
| High | 14:38 | 1.6m / 5.2ft | |
| Low | 21:28 | 0.4m / 1.3ft | |
| Tue 18 Aug | High | 03:27 | 1.1m / 3.6ft |
| Low | 08:35 | 0.7m / 2.2ft | |
| High | 15:20 | 1.6m / 5.1ft | |
| Low | 22:42 | 0.4m / 1.2ft | |
| Wed 19 Aug | High | 05:08 | 1.0m / 3.2ft |
| Low | 09:11 | 0.8m / 2.7ft | |
| High | 16:08 | 1.5m / 5.1ft | |
| Thu 20 Aug | Low | 00:01 | 0.3m / 1.0ft |
| High | 07:17 | 1.0m / 3.3ft | |
| Low | 10:02 | 1.0m / 3.1ft | |
| High | 17:06 | 1.5m / 5.0ft | |
| Fri 21 Aug | Low | 01:10 | 0.2m / 0.8ft |
| High | 08:51 | 1.1m / 3.5ft | |
| Low | 11:32 | 1.0m / 3.3ft | |
| High | 18:07 | 1.5m / 5.1ft | |
| Sat 22 Aug | Low | 02:06 | 0.2m / 0.5ft |
| High | 09:33 | 1.1m / 3.6ft | |
| Low | 12:55 | 1.0m / 3.3ft | |
| High | 19:06 | 1.6m / 5.2ft | |
| Sun 23 Aug | Low | 02:50 | 0.1m / 0.3ft |
| High | 09:59 | 1.1m / 3.8ft | |
| Low | 13:52 | 1.0m / 3.2ft | |
| High | 19:56 | 1.6m / 5.4ft |