Half Moon Bay (Pillar Point), CA tide times
Half Moon Bay (Pillar Point), CA tide forecast — heights relative to MLLW.
Today's tide times for Half Moon Bay (Pillar Point), CA
Tide times at Half Moon Bay (Pillar Point), CA on Saturday, 25 July 2026: first high tide at 08:22pm. Sunrise 06:08am, sunset 08:24pm.
Tide chart for Half Moon Bay (Pillar Point), CA
24-hour cosine-interpolated curve around the present moment. Heights relative to MLLW. Predictions: NOAA CO-OPS station 9414131.
Sun, moon and conditions on Sat 25 Jul
Snapshot at build time — refreshes daily. Sea state from NOAA harmonic predictions.
Highs and lows next 7 days
Every predicted high and low for the next week, with the daily tidal coefficient (0–120; higher = bigger swing, > 95 means stronger currents).
Other spots nearby
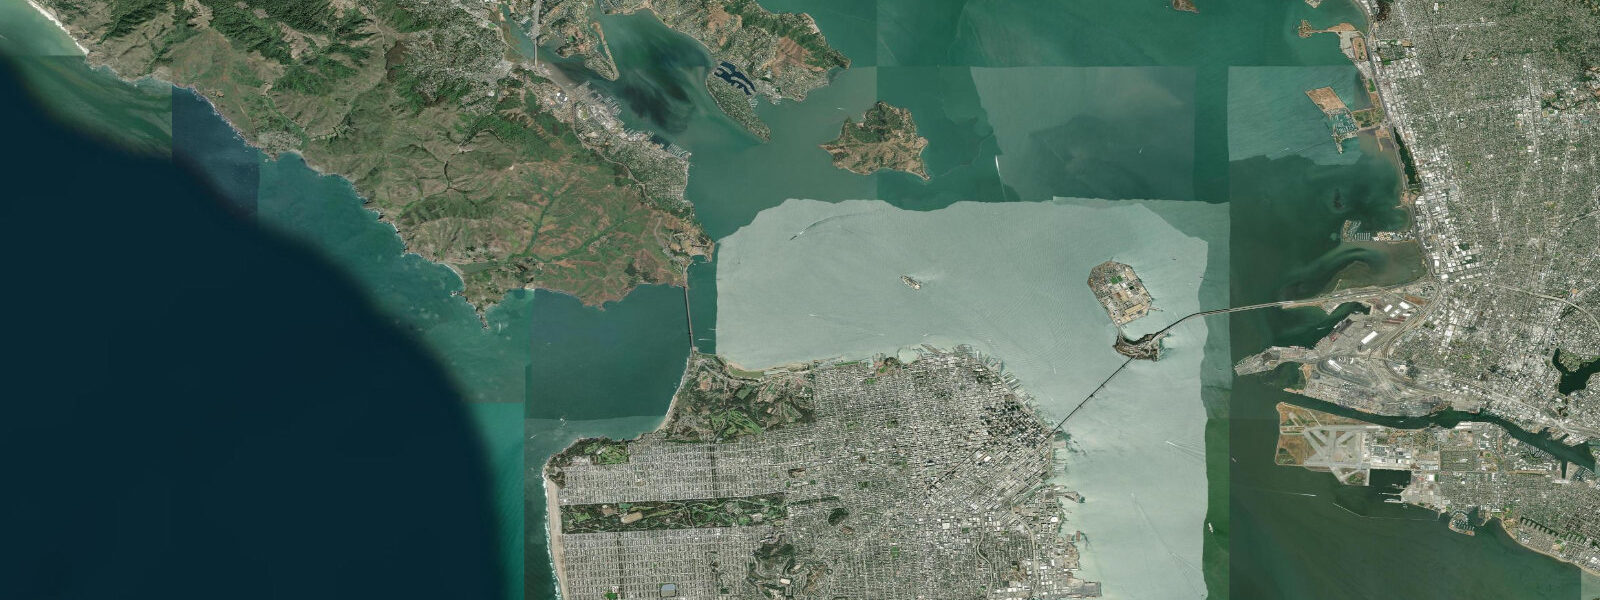
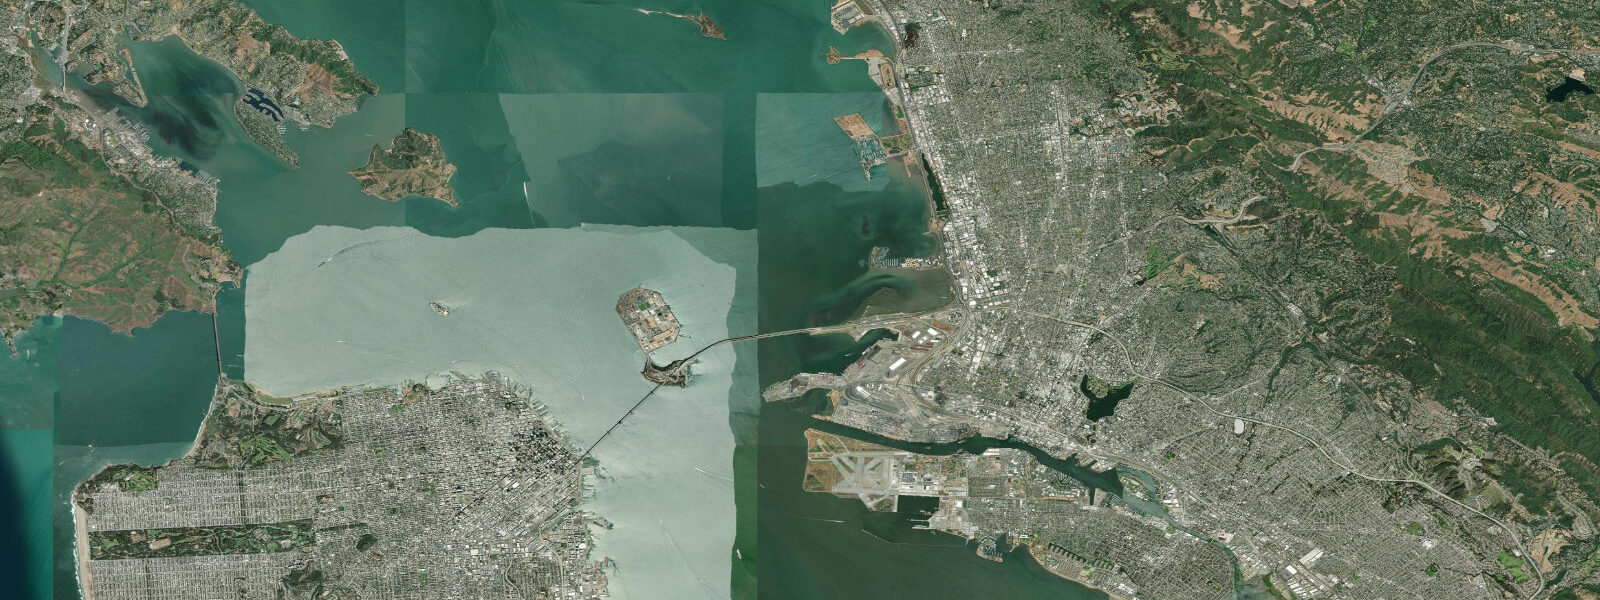
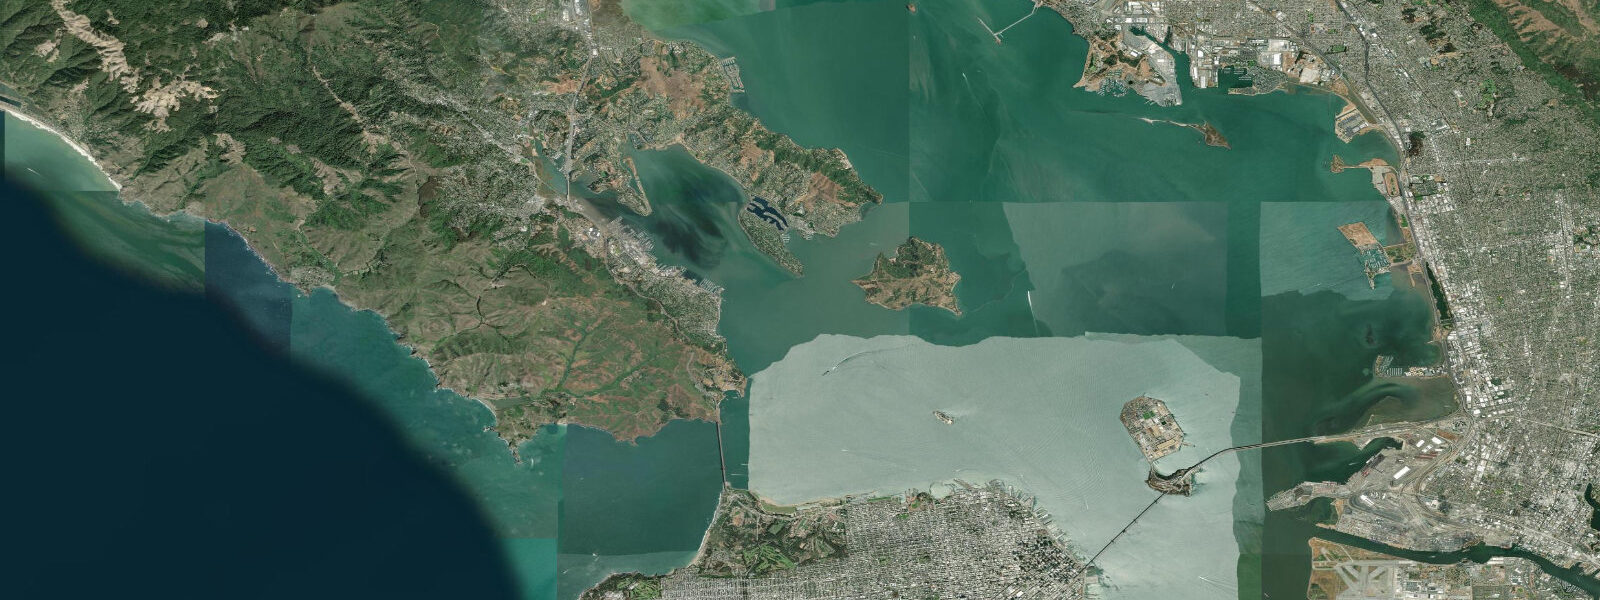
The three closest curated TideTurtle locations to Half Moon Bay (Pillar Point), CA, measured by great-circle distance.
Today's solunar windows
Solunar tradition: major periods are the ≈3h windows around moon transit and opposition; minor are ≈2h around moonrise and moonset. Pair with the local tide stage and wind for the best read.
Cycle dates near Half Moon Bay (Pillar Point), CA
Next spring tide on Tue 28 Jul (range 2.0m / 6.6ft). Last neap on Sat 25 Jul. Next neap on Thu 06 Aug.
Spring tides cluster around new and full moons (biggest swings). Neap tides land on quarter moons (smallest swings). See the spring tide and neap tide glossary entries for the why.
About tides at Half Moon Bay (Pillar Point), CA
A short guide to the coastline at Half Moon Bay (Pillar Point), CA — geography, sea state, and what the tide is actually doing under your feet.
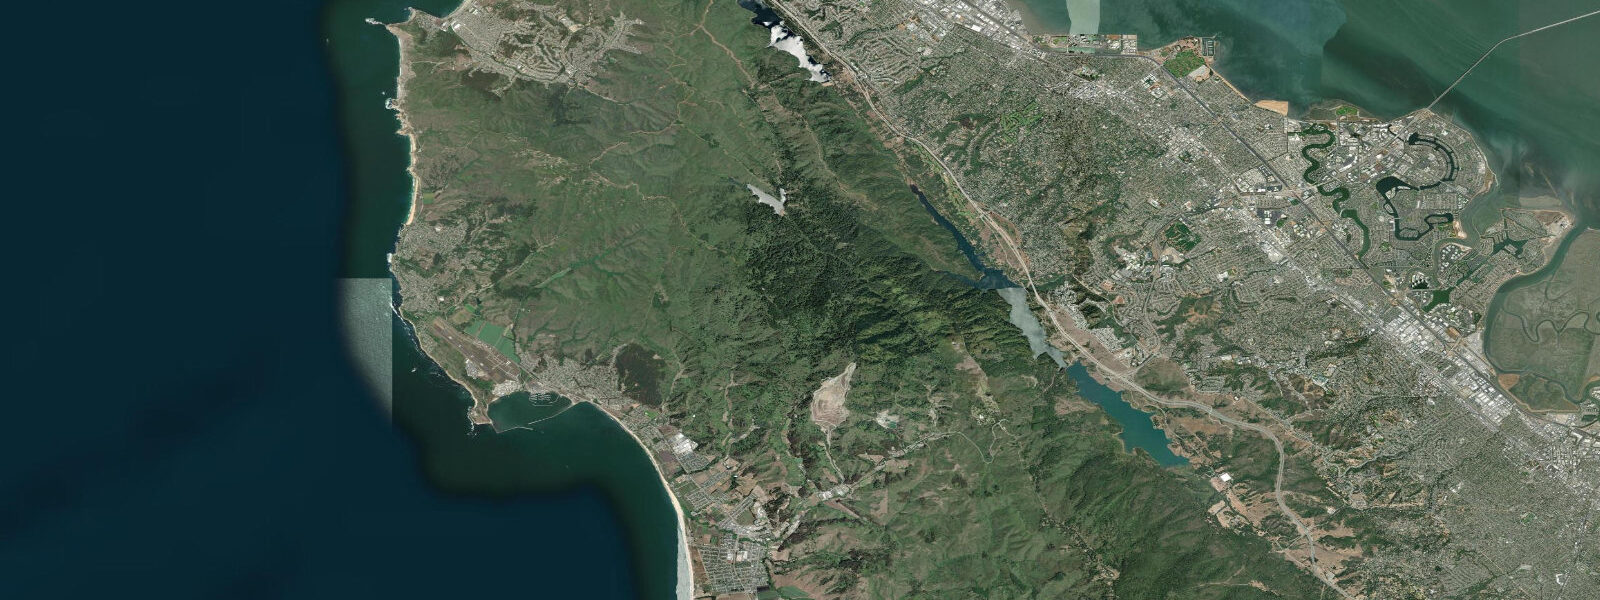
Half Moon Bay sits on the open Pacific coast of San Mateo County, about 50 km south of San Francisco, with the working harbour at Pillar Point on its northern shore and the long sand of Surfer's Beach, Miramar, and the Half Moon Bay State Beaches running south to the Tunitas Creek mouth. Pillar Point itself is the point of land that gives the harbour its breakwater, and just outside the breakwater is the offshore reef called Mavericks — one of the world's most serious big-wave surf breaks, working in winter on solid northwest groundswells with faces routinely topping 15 metres. The tide signature here is the open Pacific mixed-semidiurnal signal that the entire California coast shares — two highs and two lows of unequal size each day, the bigger swing falling on the lower-low water — with a moderate range.
0 on neaps. The local tide signature matters more for surf reading than for navigation: Mavericks works best at lower stages of the tide when the reef edge stands proud, and the inside breaks at Surfer's Beach reshape across each cycle. The harbour itself stays workable across the cycle for the commercial fishing fleet running out for Dungeness crab in winter and salmon in summer, and for the recreational charter boats heading offshore.
Lowest spring lows around new and full moons open the rocky intertidal at Fitzgerald Marine Reserve just up the coast at Moss Beach for hours either side — one of the better protected tide-pool zones on the central California coast. Pacific storm surge from winter lows can shift apparent water level 10 to 20 cm above predicted; harmonic predictions assume calm. NOAA CO-OPS station 9414131 supplies the gridded predictions on this page.
Tide questions about Half Moon Bay (Pillar Point), CA
Quick answers to the most common questions about tide times, range, and water access at Half Moon Bay (Pillar Point), CA.
When is the next high tide at Half Moon Bay?
The hero block shows the next high tide at the Pillar Point gauge in local Pacific time (PST in winter, PDT in summer). The 7-day table covers all the highs and lows. High water at Pillar Point arrives about the same time as San Francisco's Pier 22½ gauge a short way north — both sit on the open Pacific coast and read close to in-phase.
What's the typical tide range at Half Moon Bay?
Mean range at the Pillar Point gauge is about 1.6 metres, climbing past 2.1 metres on spring tides and dropping near 1.0 metre on neaps. The pattern is mixed semidiurnal — two highs and two lows of unequal size each day, the bigger swing falling on the lower-low water — the standard Pacific coast signal that San Diego, Monterey, and the rest of California shares.
Where do these tide predictions come from?
NOAA CO-OPS station 9414131 at Pillar Point Harbour. NOAA computes predictions through harmonic analysis of decades of measured water levels at this exact gauge. That is the gold-standard method for tide prediction in US waters and produces accuracy you can plan a surf check, a tidepool walk, or a kayak crossing around — under normal weather.
Does the tide affect Mavericks surf?
Yes. Mavericks is a deep-reef break that works on solid northwest groundswells in winter. The break is best at lower stages of the tide when the outside reef edge stands proud — high water buries the reef and the wave loses its shape. Local surfers and tow-in crews read the tide table together with the swell forecast (the National Weather Service buoys at 46214 Point Reyes and 46026 San Francisco) and the wind forecast for the Pillar Point offshore zone.
Is this safe to use for navigation?
No. For piloting in or out of Pillar Point Harbour, working the offshore Mavericks zone, or transiting the open coast between San Francisco and Santa Cruz use NOAA's authoritative chart products, the Coast Guard's notices to mariners, and the harbour-master's guidance for the breakwater entrance. Winter swell on the breakwater entrance is a working hazard; tow-in conditions at Mavericks are not a tide-table matter.
30-day tide table — Half Moon Bay (Pillar Point), CA
Heights relative to MLLW. Predictions: NOAA CO-OPS station 9414131 — heights relative to MLLW.
| Day | Type | Time | Height |
|---|---|---|---|
| Sat 25 Jul | High | 20:22 | 1.8m / 5.8ft |
| Sun 26 Jul | Low | 04:00 | -0.1m / -0.2ft |
| High | 10:54 | 1.2m / 3.9ft | |
| Low | 15:04 | 0.9m / 3.1ft | |
| High | 21:06 | 1.8m / 5.9ft | |
| Mon 27 Jul | Low | 04:36 | -0.1m / -0.4ft |
| High | 11:27 | 1.2m / 4.1ft | |
| Low | 15:48 | 0.9m / 3.0ft | |
| High | 21:46 | 1.8m / 6.0ft | |
| Tue 28 Jul | Low | 05:11 | -0.2m / -0.5ft |
| High | 11:58 | 1.3m / 4.2ft | |
| Low | 16:27 | 0.9m / 2.8ft | |
| High | 22:23 | 1.8m / 6.0ft | |
| Wed 29 Jul | Low | 05:43 | -0.2m / -0.5ft |
| High | 12:27 | 1.3m / 4.4ft | |
| Low | 17:07 | 0.8m / 2.7ft | |
| High | 23:00 | 1.8m / 6.0ft | |
| Thu 30 Jul | Low | 06:14 | -0.1m / -0.4ft |
| High | 12:55 | 1.4m / 4.5ft | |
| Low | 17:48 | 0.8m / 2.6ft | |
| High | 23:37 | 1.8m / 5.8ft | |
| Fri 31 Jul | Low | 06:43 | -0.1m / -0.2ft |
| High | 13:21 | 1.4m / 4.7ft | |
| Low | 18:31 | 0.7m / 2.4ft | |
| Sat 01 Aug | High | 00:17 | 1.7m / 5.5ft |
| Low | 07:10 | 0.0m / 0.1ft | |
| High | 13:47 | 1.5m / 4.8ft | |
| Low | 19:17 | 0.7m / 2.2ft | |
| Sun 02 Aug | High | 01:01 | 1.5m / 5.1ft |
| Low | 07:37 | 0.2m / 0.5ft | |
| High | 14:13 | 1.5m / 5.0ft | |
| Low | 20:07 | 0.6m / 2.0ft | |
| Mon 03 Aug | High | 01:51 | 1.4m / 4.6ft |
| Low | 08:05 | 0.3m / 1.0ft | |
| High | 14:42 | 1.6m / 5.2ft | |
| Low | 21:04 | 0.5m / 1.6ft | |
| Tue 04 Aug | High | 02:49 | 1.2m / 4.1ft |
| Low | 08:35 | 0.5m / 1.5ft | |
| High | 15:16 | 1.7m / 5.5ft | |
| Low | 22:14 | 0.4m / 1.3ft | |
| Wed 05 Aug | High | 04:06 | 1.1m / 3.6ft |
| Low | 09:12 | 0.6m / 2.1ft | |
| High | 16:00 | 1.7m / 5.7ft | |
| Low | 23:31 | 0.3m / 0.8ft | |
| Thu 06 Aug | High | 05:47 | 1.0m / 3.4ft |
| Low | 10:01 | 0.8m / 2.6ft | |
| High | 16:55 | 1.8m / 5.9ft | |
| Fri 07 Aug | Low | 00:42 | 0.1m / 0.3ft |
| High | 07:31 | 1.0m / 3.4ft | |
| Low | 11:10 | 0.9m / 2.9ft | |
| High | 17:57 | 1.9m / 6.1ft | |
| Sat 08 Aug | Low | 01:50 | -0.1m / -0.2ft |
| High | 08:56 | 1.1m / 3.7ft | |
| Low | 12:28 | 0.9m / 3.1ft | |
| High | 19:02 | 2.0m / 6.4ft | |
| Sun 09 Aug | Low | 02:50 | -0.2m / -0.7ft |
| High | 09:48 | 1.2m / 4.0ft | |
| Low | 13:47 | 0.9m / 3.0ft | |
| High | 20:06 | 2.0m / 6.7ft | |
| Mon 10 Aug | Low | 03:43 | -0.3m / -1.1ft |
| High | 10:30 | 1.3m / 4.3ft | |
| Low | 14:59 | 0.8m / 2.8ft | |
| High | 21:07 | 2.1m / 6.8ft | |
| Tue 11 Aug | Low | 04:29 | -0.4m / -1.2ft |
| High | 11:08 | 1.4m / 4.6ft | |
| Low | 15:59 | 0.7m / 2.4ft | |
| High | 22:02 | 2.1m / 6.8ft | |
| Wed 12 Aug | Low | 05:12 | -0.3m / -1.1ft |
| High | 11:45 | 1.5m / 4.9ft | |
| Low | 16:54 | 0.6m / 2.1ft | |
| High | 22:53 | 2.0m / 6.6ft | |
| Thu 13 Aug | Low | 05:53 | -0.3m / -0.8ft |
| High | 12:22 | 1.6m / 5.1ft | |
| Low | 17:48 | 0.5m / 1.8ft | |
| High | 23:45 | 1.9m / 6.2ft | |
| Fri 14 Aug | Low | 06:32 | -0.1m / -0.4ft |
| High | 12:58 | 1.6m / 5.3ft | |
| Low | 18:42 | 0.5m / 1.5ft | |
| Sat 15 Aug | High | 00:37 | 1.7m / 5.7ft |
| Low | 07:08 | 0.1m / 0.2ft | |
| High | 13:32 | 1.7m / 5.5ft | |
| Low | 19:36 | 0.4m / 1.4ft | |
| Sun 16 Aug | High | 01:30 | 1.5m / 5.1ft |
| Low | 07:42 | 0.3m / 0.9ft | |
| High | 14:06 | 1.7m / 5.5ft | |
| Low | 20:31 | 0.4m / 1.3ft | |
| Mon 17 Aug | High | 02:25 | 1.4m / 4.4ft |
| Low | 08:14 | 0.5m / 1.6ft | |
| High | 14:41 | 1.7m / 5.5ft | |
| Low | 21:31 | 0.4m / 1.2ft | |
| Tue 18 Aug | High | 03:29 | 1.2m / 3.9ft |
| Low | 08:46 | 0.7m / 2.2ft | |
| High | 15:19 | 1.6m / 5.4ft | |
| Low | 22:41 | 0.4m / 1.2ft | |
| Wed 19 Aug | High | 04:58 | 1.1m / 3.5ft |
| Low | 09:22 | 0.8m / 2.7ft | |
| High | 16:05 | 1.6m / 5.3ft | |
| Low | 23:52 | 0.3m / 1.0ft | |
| Thu 20 Aug | High | 06:44 | 1.0m / 3.4ft |
| Low | 10:16 | 0.9m / 3.1ft | |
| High | 17:02 | 1.6m / 5.2ft | |
| Fri 21 Aug | Low | 00:57 | 0.3m / 0.9ft |
| High | 08:22 | 1.1m / 3.6ft | |
| Low | 11:39 | 1.0m / 3.3ft | |
| High | 18:03 | 1.6m / 5.2ft | |
| Sat 22 Aug | Low | 01:57 | 0.2m / 0.6ft |
| High | 09:17 | 1.1m / 3.8ft | |
| Low | 12:54 | 1.0m / 3.3ft | |
| High | 19:03 | 1.6m / 5.3ft | |
| Sun 23 Aug | Low | 02:48 | 0.1m / 0.4ft |
| High | 09:51 | 1.2m / 4.0ft | |
| Low | 14:00 | 1.0m / 3.2ft | |
| High | 19:59 | 1.7m / 5.5ft |