San Sebastián tide times
San Sebastián tide forecast — heights relative to MSL.
Today's tide times for San Sebastián
Tide times at San Sebastián on Sunday, 21 June 2026: first high tide at 02:00, first low tide at 03:35, second high tide at 10:03, second low tide at 15:50, third high tide at 22:20. Sunrise 06:27, sunset 21:51.
Tide chart for San Sebastián
24-hour cosine-interpolated curve around the present moment. Heights relative to MSL. Predictions: Predictions: Open-Meteo Marine (MeteoFrance SMOC, 0.08° grid).
Sun, moon and conditions on Sun 21 Jun
Snapshot at build time — refreshes daily. Sea state from Open-Meteo Marine.
Highs and lows next 7 days
Every predicted high and low for the next week, with the daily tidal coefficient (0–120; higher = bigger swing, > 95 means stronger currents).
Other spots nearby
The three closest curated TideTurtle locations to San Sebastián, measured by great-circle distance.
Today's solunar windows
Solunar tradition: major periods are the ≈3h windows around moon transit and opposition; minor are ≈2h around moonrise and moonset. Pair with the local tide stage and wind for the best read.
Cycle dates near San Sebastián
Last spring tide on Sun 21 Jun (range 2.7m). Next spring tide on Sat 27 Jun (range 2.3m). Next neap on Wed 24 Jun.
Spring tides cluster around new and full moons (biggest swings). Neap tides land on quarter moons (smallest swings). See the spring tide and neap tide glossary entries for the why.
About tides at San Sebastián
A short guide to the coastline at San Sebastián — geography, sea state, and what the tide is actually doing under your feet.
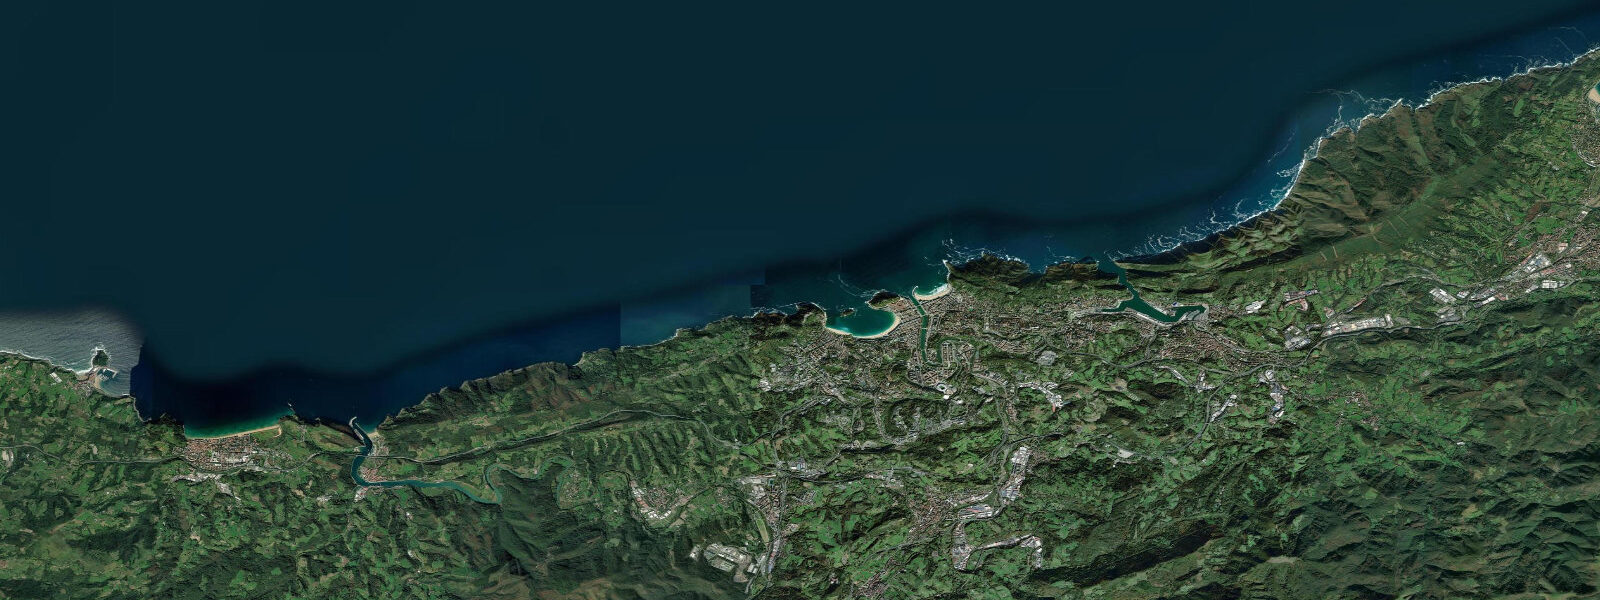
San Sebastián sits in the southeast corner of the Bay of Biscay, built around La Concha — one of the most architecturally composed bays in Europe. The bay curves roughly 1.5 kilometres between Monte Urgull to the east and Monte Igueldo to the west, with the island of Santa Clara planted in the centre. The mean tidal range here is approximately 3.5 metres; mean spring range reaches 4.0 metres. That range reshapes La Concha continuously through the day: at low water, the beach is 70 to 100 metres wide from the promenade wall to the water's edge; at high water, the sea comes within a few metres of the railings and the beach narrows to a fringe.
The tidal behaviour of La Concha matters for practical planning. Morning swims at low water in summer mean walking across 80 metres of warm sand before entering calm, shallow water. The same beach at high water becomes a narrow slip of sand against the iconic white balustrade promenade — beautiful, but crowded against the sea wall. The water temperature in La Concha reaches 21 to 23°C in July and August; the sheltered bay geometry keeps wave height minimal except when northwesterly swells wrap inside. The island of Santa Clara creates a partial breakwater for swells from the northwest.
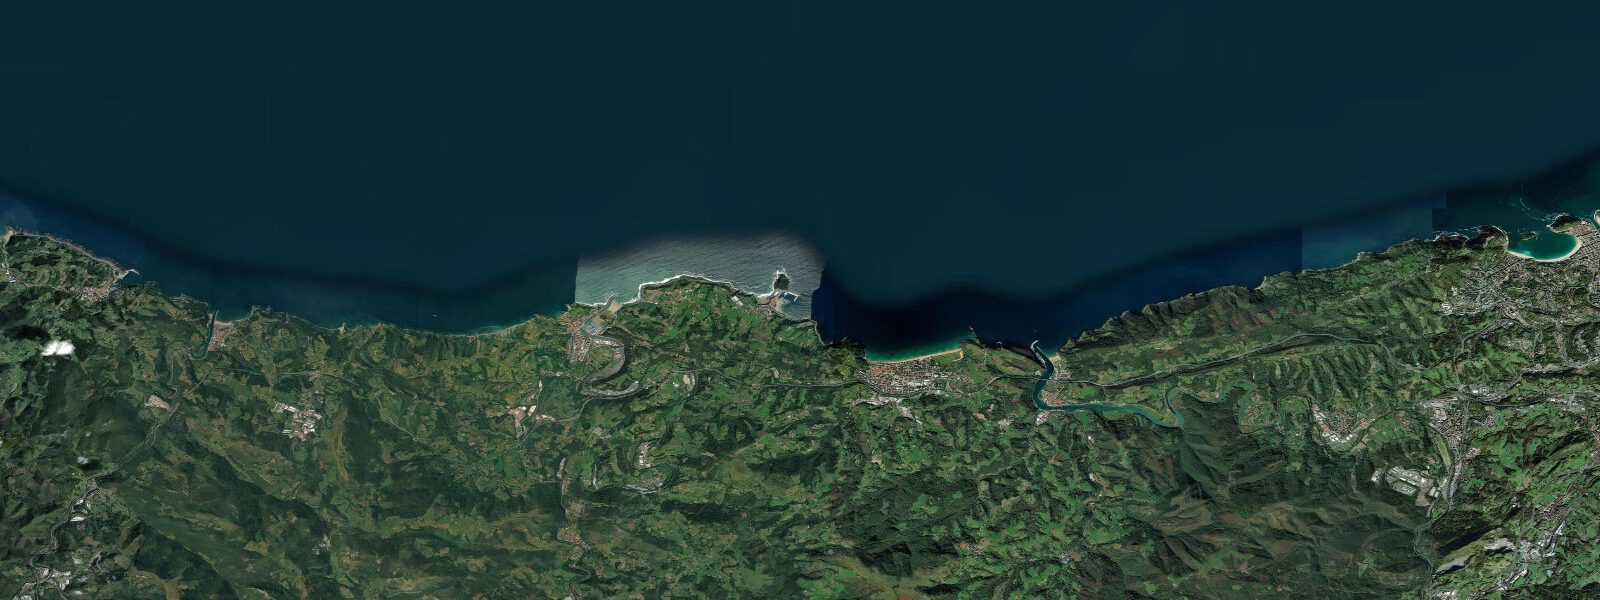
Urkiola and Zurriola are the other San Sebastián beaches. Zurriola, east of the Urumea river mouth and outside the protection of the bay headlands, is fully exposed to Atlantic swell — it is San Sebastián's surf beach. Surf reaches 1 to 3 metres in autumn and winter, dropping to flat summer. The Kursaal auditorium (two glass cubes on the Zurriola seafront, 1999) marks the boundary between the two beach characters.
The Parte Vieja (old town) is pinched onto the base of Monte Urgull and contains the highest density of pintxos bars per square metre in Spain. The ritual is counter-service: select pintxos from the bar-top display, keep your skewer count, settle at the end. The best pintxos hour is 12:30 to 14:00 or 19:30 to 21:00; after 22:00 the offerings are depleted. Bar Nestor (calle de la Pescadería) does a tortilla that people queue for before noon.
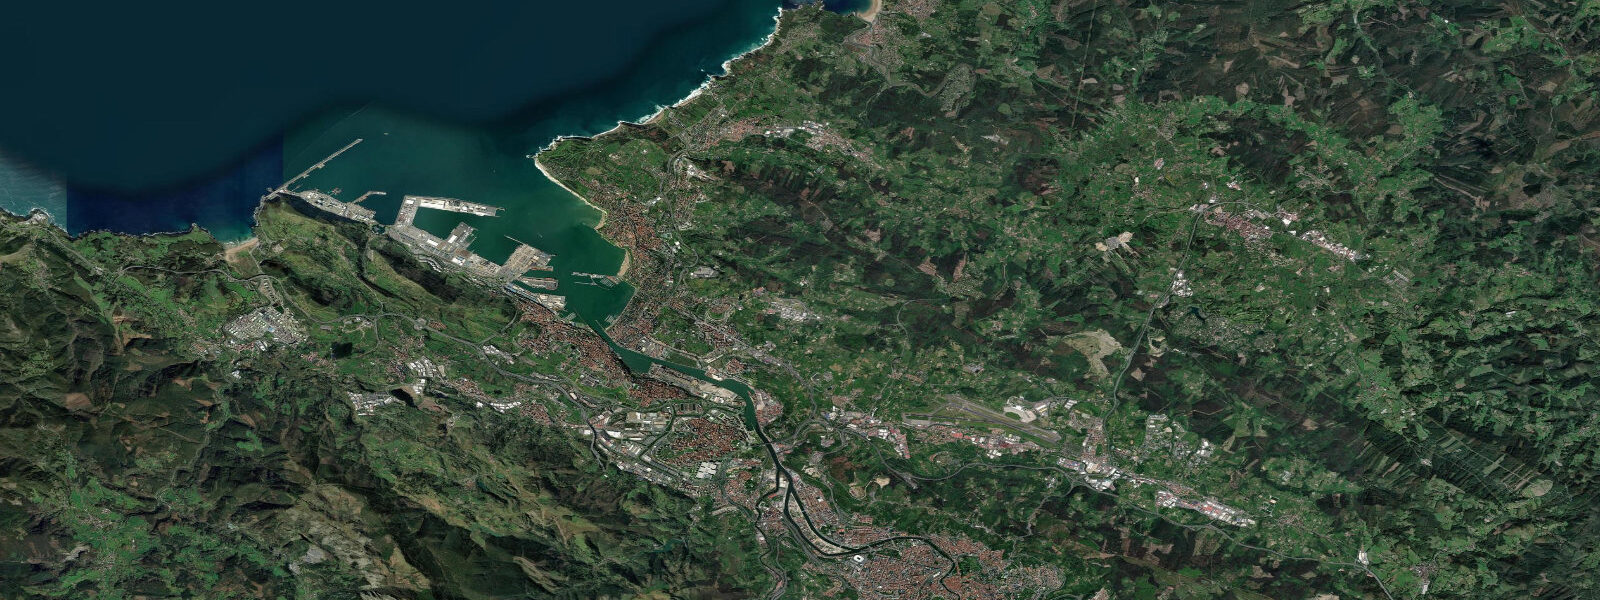
Fishing boats land catch at the La Bretxa market area and the port fishermen's wharf on the west of the bay. Anchoa (anchovy from the Cantabrian) is the most important local product — fresh in April through June, salted and cured for year-round use. The fresh anchovy season and the bonito season (July–September) define the culinary calendar.
Surfing the point at Zarautz (22 km west) or the estuary mouth at Mundaka (85 km west) is the standard day-trip for surfers based in San Sebastián. The Zurriola local break works during autumn swells without the drive. The surf forecast and low-tide timing need to align for Mundaka — the famous left works best on an ebbing tide.
Tide predictions on this page come from Open-Meteo Marine, a gridded global ocean model. Accuracy is typically within plus or minus 45 minutes on timing and 0.2 to 0.3 metres on height — model-derived, not from a local tide gauge. For authoritative official predictions, Puertos del Estado (puertos.es) publishes gauge-based tide tables for Pasajes, 6 km east of San Sebastián's city centre.
Tide questions about San Sebastián
Quick answers to the most common questions about tide times, range, and water access at San Sebastián.
What is the tidal range at San Sebastián and how does it affect La Concha beach?
San Sebastián has a semidiurnal macrotidal regime — two high and two low tides per day. Mean tidal range is approximately 3.5 metres; mean spring range is around 4.0 metres. At La Concha, the beach width changes by 70 to 100 metres between low and high water. At a mean low water of roughly 0.6 m above chart datum, the full beach is exposed and shallow water extends well out toward the island. At high water (around 4.0–4.5 m on springs), the sea comes within a few metres of the promenade railings. For beach swimming, low to mid-falling tide gives the most usable beach width and the warmest shallow water in summer.
Which San Sebastián beach is best for surfing?
Zurriola (Playa de Gros), east of the Urumea river mouth, is the surf beach — fully exposed to Atlantic swell from the north and northwest with no bay headland protection. It produces consistent beach-break waves at 1 to 3 metres from September through April; summer is generally flat. The wave quality is variable (beach break, no fixed peak) but reliable for intermediate surfers. La Concha is not a surf beach — the bay geometry kills swell. Zarautz (22 km west) and Mundaka (85 km west) are the serious surf day trips from the city.
What are pintxos and where do you eat them in San Sebastián's old town?
Pintxos (the Basque equivalent of tapas, pronounced 'pinchos') are small prepared foods served on slices of bread or on skewers, displayed along bar counters. You pick what you want, keep track of what you ate, and pay at the end — the skewer count is the reckoning. The Parte Vieja (old town) has the highest concentration, particularly on calle de la Pescadería, calle 31 de Agosto, and calle Fermín Calbetón. Peak pintxos hours are 12:30 to 14:00 and 19:30 to 21:30. Anchoas (anchovies from the Cantabrian) on bread are the canonical local pintxo.
What is the best time to visit San Sebastián for water activities?
July and August for sea swimming — La Concha water temperature reaches 21 to 23°C, the bay is calm, and the beach is at its widest at low tide. September for surfing at Zurriola — first Atlantic swells arrive as summer ends, water is still 19 to 20°C, and the crowds thin. October through March for Mundaka surf day trips — the famous left-hand estuary break at Mundaka works on autumn northwesterly swells combined with a dropping tide. Year-round for food and old town — Semana Grande (August) and the Basque Culinary World Forum draw additional visitors.
Are the tide predictions on this page official forecasts I can use for navigation or water safety planning?
No. The predictions shown here come from Open-Meteo Marine, a gridded global ocean model. They are provided for general coastal planning — choosing a swim time, timing a beach walk, or understanding the tide cycle — and carry a typical accuracy of plus or minus 45 minutes on timing and 0.2 to 0.3 metres on height. For navigation, maritime safety, fishing vessel passage, or any decision where accuracy is safety-critical, use the official predictions from Puertos del Estado (puertos.es), which publishes gauge-based tide tables for Pasajes, the nearest official gauge to San Sebastián.
8-day tide table — San Sebastián
Heights relative to MSL. Predictions: Open-Meteo Marine (MeteoFrance SMOC, 0.08° grid) — heights relative to MSL (not chart datum / LAT). Model-derived.
| Day | Type | Time | Height |
|---|---|---|---|
| Sun 21 Jun | High | 02:00 | -1.4m |
| Low | 03:35 | -1.8m | |
| High | 10:03 | 0.7m | |
| Low | 15:50 | -1.5m | |
| High | 22:20 | 0.9m | |
| Mon 22 Jun | Low | 04:32 | -1.6m |
| High | 11:02 | 0.6m | |
| Low | 16:50 | -1.4m | |
| High | 23:21 | 0.7m | |
| Tue 23 Jun | Low | 05:32 | -1.4m |
| High | 12:03 | 0.6m | |
| Low | 17:55 | -1.3m | |
| Wed 24 Jun | High | 00:32 | 0.6m |
| Low | 19:01 | -1.2m | |
| Thu 25 Jun | High | 01:32 | 0.6m |
| Low | 07:27 | -1.3m | |
| High | 14:01 | 0.7m | |
| Low | 20:00 | -1.3m | |
| Fri 26 Jun | High | 02:32 | 0.6m |
| Low | 08:21 | -1.3m | |
| High | 14:53 | 0.8m | |
| Low | 20:52 | -1.4m | |
| Sat 27 Jun | High | 03:18 | 0.7m |
| Low | 09:09 | -1.4m | |
| High | 15:38 | 0.8m | |
| Low | 21:37 | -1.5m | |
| Sun 28 Jun | High | 01:00 | -0.2m |