Sylt-Westerland tide times
Sylt-Westerland tide forecast — heights relative to MSL.
Today's tide times for Sylt-Westerland
Tide times at Sylt-Westerland on Sunday, 26 July 2026: first high tide at 02:00, first low tide at 04:32, second high tide at 10:19, second low tide at 17:08, third high tide at 22:55. Sunrise 05:23, sunset 21:41.
Tide chart for Sylt-Westerland
24-hour cosine-interpolated curve around the present moment. Heights relative to MSL. Predictions: Predictions: Open-Meteo Marine (MeteoFrance SMOC, 0.08° grid).
Sun, moon and conditions on Sun 26 Jul
Snapshot at build time — refreshes daily. Sea state from Open-Meteo Marine.
Highs and lows next 7 days
Every predicted high and low for the next week, with the daily tidal coefficient (0–120; higher = bigger swing, > 95 means stronger currents).
Other spots nearby
The three closest curated TideTurtle locations to Sylt-Westerland, measured by great-circle distance.
Today's solunar windows
Solunar tradition: major periods are the ≈3h windows around moon transit and opposition; minor are ≈2h around moonrise and moonset. Pair with the local tide stage and wind for the best read.
Cycle dates near Sylt-Westerland
Next spring tide on Sat 01 Aug (range 2.3m). Last neap on Sun 26 Jul.
Spring tides cluster around new and full moons (biggest swings). Neap tides land on quarter moons (smallest swings). See the spring tide and neap tide glossary entries for the why.
About tides at Sylt-Westerland
A short guide to the coastline at Sylt-Westerland — geography, sea state, and what the tide is actually doing under your feet.
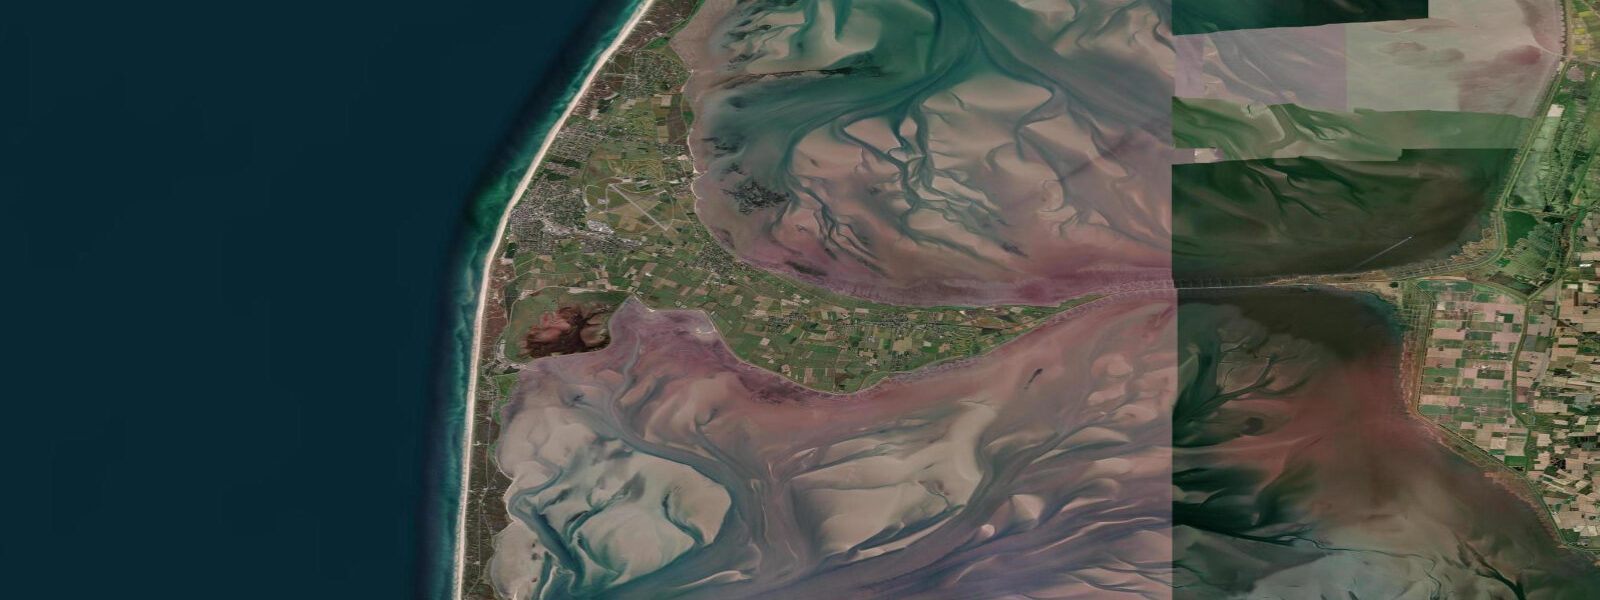
Sylt is the long thin island that runs along the northern German coast at the Danish border, a forty-kilometre strip of dunes, beach, and the open North Sea on its western flank. Westerland is the main town in the middle of the island, and the open beach there is the reference point for everything else. 8 metres, semidiurnal, two highs and two lows about twelve and a half hours apart.
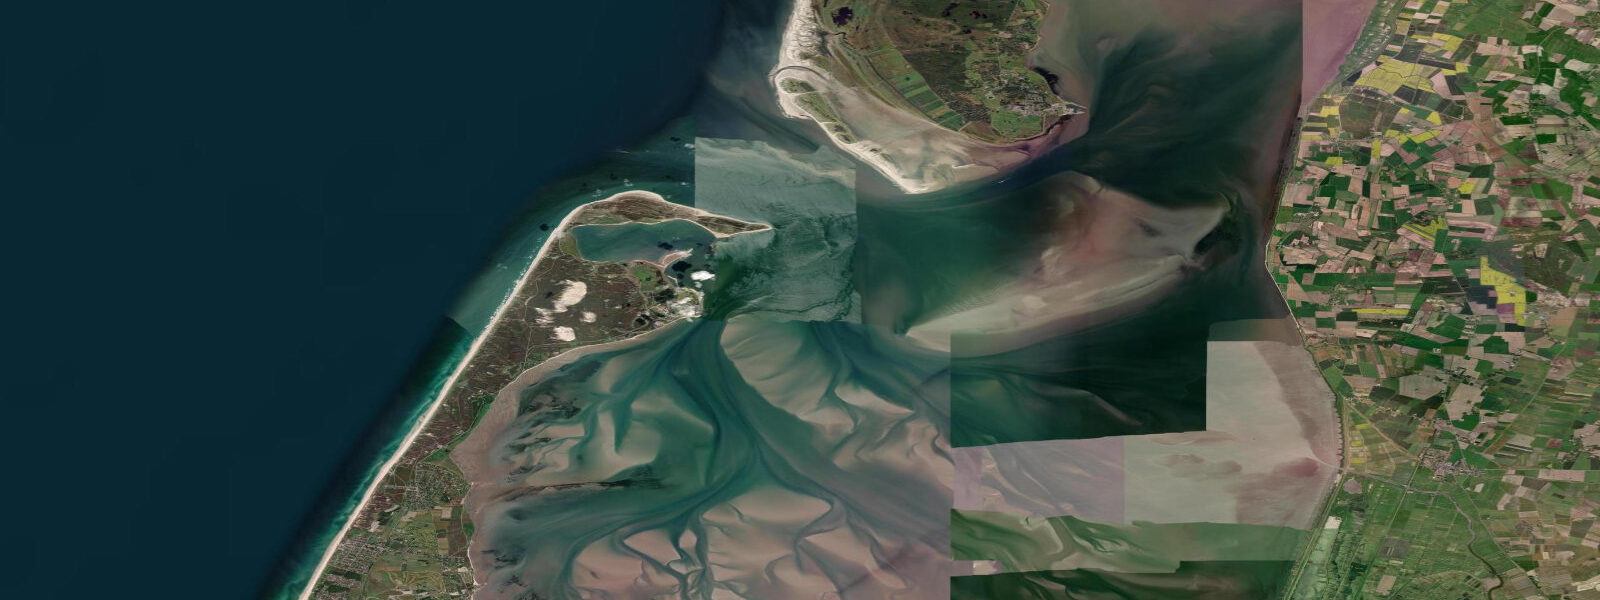
4. The Wadden side of the island, sheltered behind the dunes on the east, drains and refills the same way the rest of the southern Bight does — the tideflats out toward Keitum and List open up completely on the ebb. For anyone walking the kilometres of open beach from Westerland north to Kampen, paddleboarding the lagoon at Hörnum, or watching the surf at Sylt's open-coast breaks, the timing of the swing changes the day.
Predictions on this page come from Open-Meteo Marine, gridded model output — useful for planning, not navigation-grade. BSH operates the authoritative German tide gauges; the closest to Sylt is Pegel List.
Tide questions about Sylt-Westerland
Quick answers to the most common questions about tide times, range, and water access at Sylt-Westerland.
When is the next high tide at Sylt-Westerland?
The hero block shows the next high tide at the open-beach reference for Westerland in Berlin local time, height above MSL. The 7-day table covers daily highs and lows. Note that the Wadden side of the island (toward List and Keitum) sees the tide reach about 30–60 minutes after the open-coast Westerland signal.
What's the typical tide range at Sylt?
Mean range on the open west coast at Westerland is about 1.8 metres — smaller than Cuxhaven's 2.8 because Sylt sits further out from the funnel-shaped southern Bight. Spring tides push to around 2.2 metres. The east side of the island, on the Wadden, runs a similar range with a small phase delay behind the open coast.
Where do these tide predictions come from?
Open-Meteo Marine, a gridded global ocean-model grid. Useful general planning data, not navigation-grade. The Bundesamt für Seeschifffahrt und Hydrographie (BSH) operates the authoritative German tide gauges; the closest to Sylt is Pegel List on the northern tip of the island.
When does the Wadden side of Sylt open up for walking?
The tide flats out toward Keitum and List open up around low water on most days, especially on spring lows around new and full moons. Walking out unguided is risky — the channels refill quickly and visibility can drop fast. The 7-day table on this page flags each day's predicted low; consider a guided wattwanderung from a local nationalpark provider for safety.
Is this safe to use for navigation?
No. For piloting in German waters use BSH's authoritative tide tables and chart products plus the latest navigational warnings. Open-Meteo's gridded predictions are general planning data, not a navigational source. The Wadden Sea is particularly demanding navigationally — local pilotage is the right tool.
8-day tide table — Sylt-Westerland
Heights relative to MSL. Predictions: Open-Meteo Marine (MeteoFrance SMOC, 0.08° grid) — heights relative to MSL (not chart datum / LAT). Model-derived.
| Day | Type | Time | Height |
|---|---|---|---|
| Sun 26 Jul | High | 02:00 | 0.1m |
| Low | 04:32 | -0.7m | |
| High | 10:19 | 0.7m | |
| Low | 17:08 | -0.9m | |
| High | 22:55 | 0.5m | |
| Mon 27 Jul | Low | 05:23 | -0.9m |
| High | 11:13 | 0.6m | |
| Low | 17:58 | -1.0m | |
| High | 23:39 | 0.5m | |
| Tue 28 Jul | Low | 06:15 | -1.1m |
| High | 12:14 | 0.5m | |
| Low | 18:48 | -1.2m | |
| Wed 29 Jul | High | 00:37 | 0.4m |
| Low | 07:03 | -1.2m | |
| High | 13:03 | 0.6m | |
| Thu 30 Jul | Low | 07:40 | -1.2m |
| High | 13:43 | 0.8m | |
| Low | 20:14 | -1.3m | |
| Fri 31 Jul | High | 02:10 | 0.5m |
| Low | 08:21 | -1.2m | |
| High | 14:24 | 0.7m | |
| Low | 20:54 | -1.4m | |
| Sat 01 Aug | High | 02:52 | 0.5m |
| Low | 09:00 | -1.2m | |
| High | 15:02 | 0.8m | |
| Low | 21:32 | -1.4m | |
| Sun 02 Aug | High | 01:00 | -0.1m |