Punta Cana tide times
Punta Cana tide forecast — heights relative to MSL.
Today's tide times for Punta Cana
Tide times at Punta Cana on Wednesday, 29 July 2026: first low tide at 01:45pm, first high tide at 09:15pm. Sunrise 06:10am, sunset 07:09pm.
Tide chart for Punta Cana
24-hour cosine-interpolated curve around the present moment. Heights relative to MSL. Predictions: Predictions: Open-Meteo Marine (MeteoFrance SMOC, 0.08° grid).
Sun, moon and conditions on Wed 29 Jul
Snapshot at build time — refreshes daily. Sea state from Open-Meteo Marine.
Highs and lows next 7 days
Every predicted high and low for the next week, with the daily tidal coefficient (0–120; higher = bigger swing, > 95 means stronger currents).
Other spots nearby
The three closest curated TideTurtle locations to Punta Cana, measured by great-circle distance.
Today's solunar windows
Solunar tradition: major periods are the ≈3h windows around moon transit and opposition; minor are ≈2h around moonrise and moonset. Pair with the local tide stage and wind for the best read.
About tides at Punta Cana
A short guide to the coastline at Punta Cana — geography, sea state, and what the tide is actually doing under your feet.
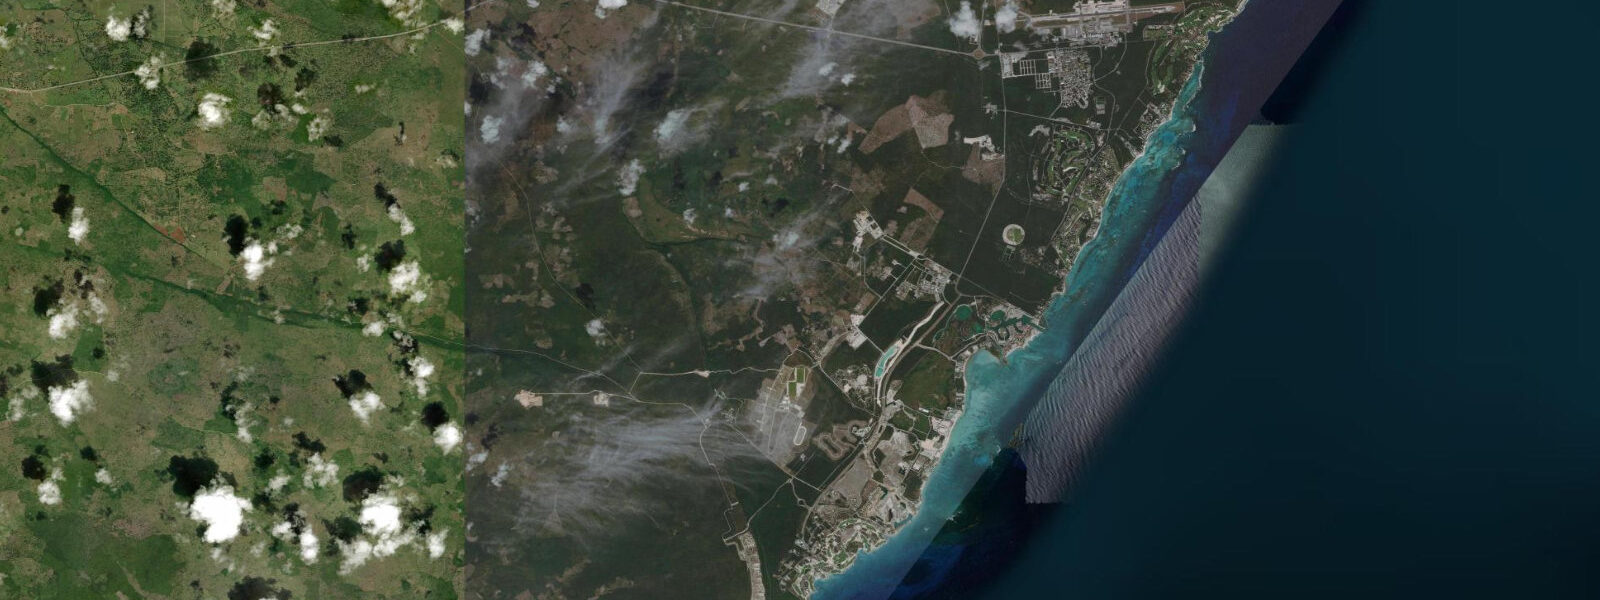
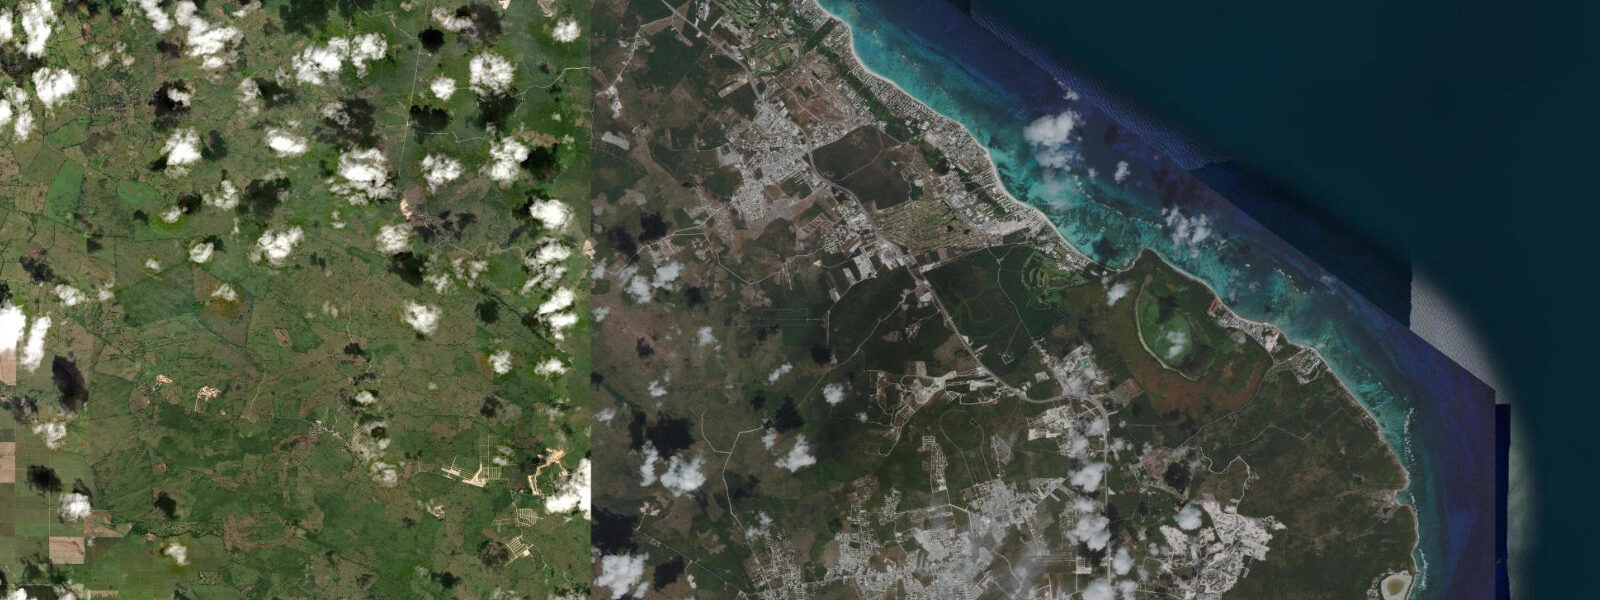
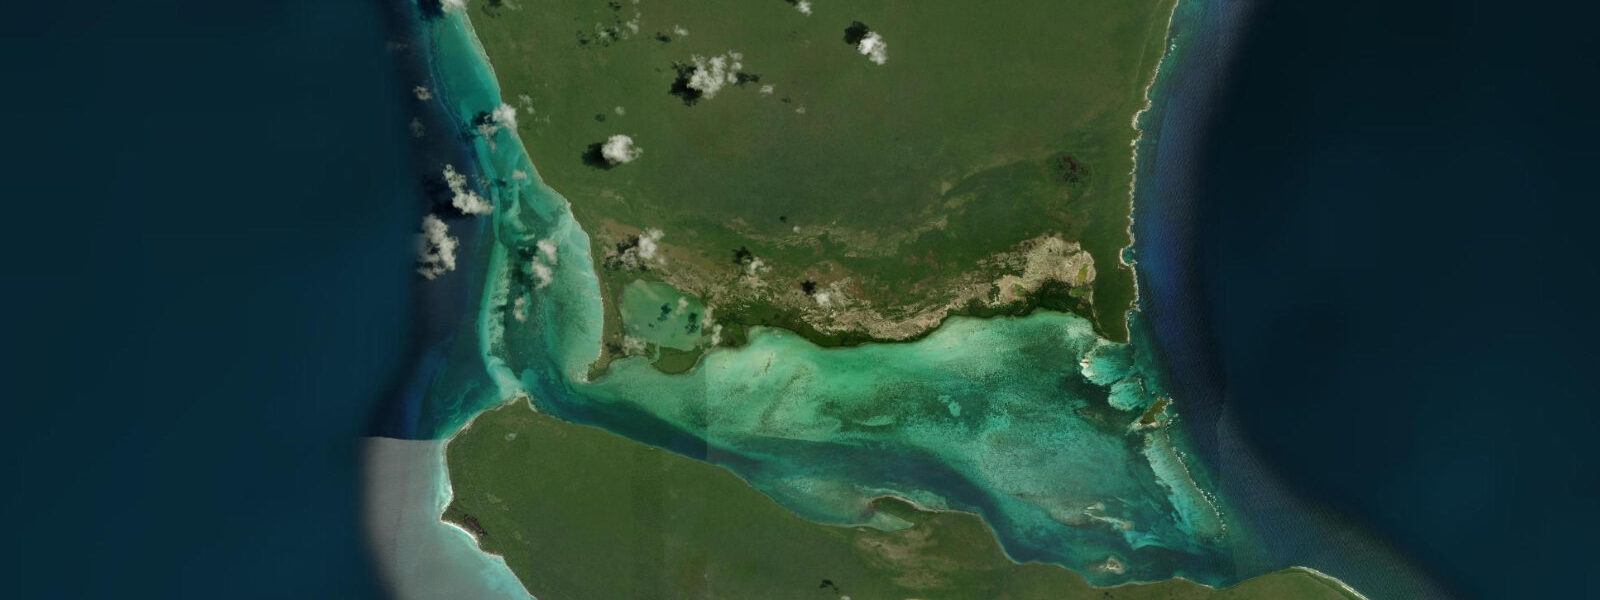
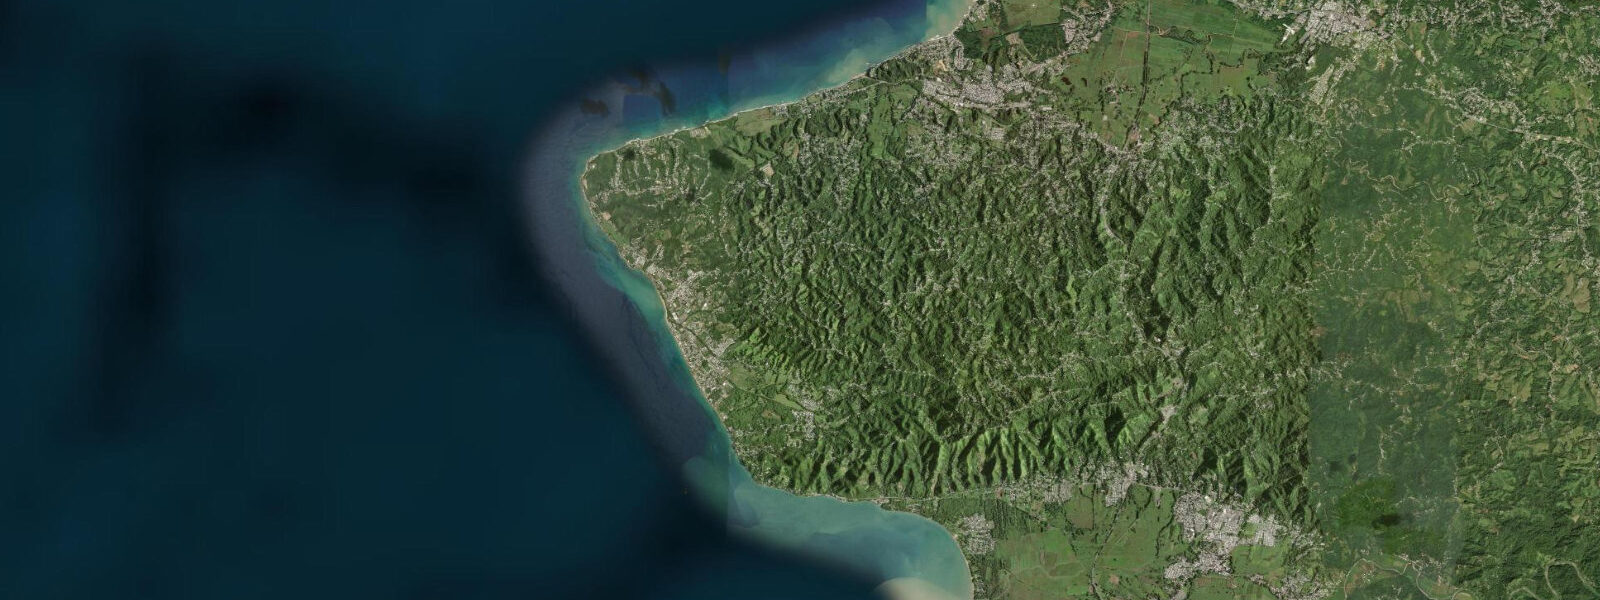
Punta Cana sits at the easternmost corner of the Dominican Republic, the point on the southern flank of Cabo Engaño where the Caribbean meets the Atlantic and the trade wind has been working the same fringing reef for as long as the coast has existed. The shoreline runs north from the Cap Cana marina through Punta Cana proper, past Cabeza de Toro, and on to the long sweep of Bávaro beach — close to thirty kilometres of white sand fronted, almost without break, by a coral reef sitting two to four hundred metres offshore. The Cabo Engaño lighthouse marks the corner where the coast bends from south-facing to east-facing, and inland from the resort strip the limestone country holds the Hoyo Azul cenote and a network of freshwater springs that feed the lagoons.
The tide here is mixed semidiurnal and small. Mean astronomical range at Punta Cana sits around 30 to 50 cm, with two highs and two lows daily that are usually unequal — the morning high often differs from the evening high by ten to twenty centimetres, and the same asymmetry runs through the lows. The reef belt is what makes the coastline work as a swimming and family beach: the bulk of any open-ocean swell breaks at the reef edge, and inside the lagoon the water is calm and shallow with a small daily flush that follows the tide signal through the reef passes.
Outside the reef, the swell pattern is governed by Atlantic weather systems, the seasonal trade wind setup, and the late-autumn northerly pulses that run down the islands. None of that comes from the tide table. What does come from the tide is the low-water exposure on the inner-lagoon sand flats and the slightly stronger flow through the reef passes around the time of high and low slack.
Anglers fishing the reef edge from small boats out of Cap Cana time the slack windows for casting; the bonefish flats on the inner side of the reef are best worked on a falling tide that drops the shallow water enough to push the fish into the channels. Paddlers and SUP riders along the Bávaro lagoon read wind first, tide second — a sustained 15-knot trade wind matters more than the 30 cm tide swing. Beach-walking families along Bávaro and Cabeza de Toro find the firmest sand on the falling tide, and the same falling tide opens the small reef-flat tidepools where juvenile reef fish, urchins, and the occasional starfish sit waiting for the next flood.
Photographers shooting the Cabo Engaño lighthouse and the Cap Cana marina entrance get the cleanest reflections at the slack of low tide when the lagoon is at its calmest. Inland from the resort strip, the limestone country holds Hoyo Azul cenote at Scape Park — a freshwater sinkhole unconnected to the tide signal, but typical of the karst geology that defines the eastern DR and feeds the freshwater springs along the coast. The seasonal pattern matters as much as the daily tide: from December through March, the trade wind builds steadily and the late-Atlantic swell pulses arrive at the reef edge with the cold-front weather running down the eastern seaboard; from June through November, the hurricane season risk is the dominant input on coastal planning, and the astronomical tide is a minor consideration relative to whatever weather system is approaching the island.
The predictions on this page come from Open-Meteo Marine, a gridded global ocean model. 3 metres on height. For a coast with a tide range this small, the height uncertainty is a meaningful fraction of the actual astronomical signal — the rhythm and timing are useful, but the predicted height should be treated as approximate.
The authoritative regional source is the Servicio Hidrográfico de la Armada Dominicana (the Dominican Navy's hydrographic service); NOAA's gauges in adjacent Puerto Rico (Mayagüez and San Juan) carry the wider Mona Passage tidal context.
Tide questions about Punta Cana
Quick answers to the most common questions about tide times, range, and water access at Punta Cana.
When is the next high tide at Punta Cana?
The hero block at the top of this page shows the next predicted high at Punta Cana in local Atlantic Standard Time (AST, UTC-4, no DST). The astronomical tide range here is small — around 30 to 50 cm — and the pattern is mixed semidiurnal, so the two daily highs are usually of unequal size. The Servicio Hidrográfico de la Armada Dominicana publishes the authoritative tide tables for Dominican ports, and NOAA's gauges across the Mona Passage at Mayagüez and San Juan in Puerto Rico carry the wider regional tidal context.
What's the typical tide range at Punta Cana?
Mean astronomical range at Punta Cana is around 30 to 50 cm — small by ocean standards, and small even by Caribbean standards. The pattern is mixed semidiurnal: two highs and two lows daily, with noticeable inequality between morning and evening highs (the difference can be ten to twenty centimetres). Spring tides around new and full moons push the swing slightly larger; neap tides compress it further. What dominates the actual water level on the Bávaro-Punta Cana lagoon is wind, the offshore reef, and seasonal Atlantic swell — not the astronomical tide.
Where do these tide predictions come from?
Open-Meteo Marine, a free gridded global ocean model. Gridded models estimate tidal height across a geographic grid rather than computing from decades of measured harmonic data at a single gauge — accuracy is typically within plus or minus 45 minutes on timing and within roughly 0.3 metres on height. For a station with a tide range this small (30 to 50 cm), that height uncertainty is a meaningful fraction of the total signal. For authoritative Dominican coastal data, use the Servicio Hidrográfico de la Armada Dominicana.
Does the reef matter more than the tide at Punta Cana?
For most beach activities along Bávaro, Cabeza de Toro, and Punta Cana proper, yes. The fringing reef sitting 200 to 400 metres offshore breaks the bulk of any open-ocean swell, so the inner lagoon stays calm regardless of what the Atlantic is doing outside. The tide signal drives a small daily flush through the reef passes, but the reef itself is the dominant control on water clarity, current, and wave height inside the lagoon. Outside the reef edge, swell and wind take over and the tide is a minor input. The slack windows around predicted high and low (about 30 minutes either side) give the lowest-current periods through the reef passes for paddlers and small-boat operators.
Is this safe to use for navigation?
No. For vessel operations along the Punta Cana coast, the Cap Cana marina approach, and the reef passes between Bávaro and Cabo Engaño, use official charts from the Servicio Hidrográfico de la Armada Dominicana and the international charts produced by NOAA, the UK Hydrographic Office, or the SHOM that cover the eastern DR coast. The reef geometry is real and unforgiving — local pilotage is the standard for small craft transiting the inshore lagoon. For sport fishing and dive operations out of Cap Cana, the marina and operator briefings carry the operational tide and current information.
7-day tide table — Punta Cana
Heights relative to MSL. Predictions: Open-Meteo Marine (MeteoFrance SMOC, 0.08° grid) — heights relative to MSL (not chart datum / LAT). Model-derived.
| Day | Type | Time | Height |
|---|---|---|---|
| Wed 29 Jul | Low | 13:45 | 0.1m |
| High | 21:15 | 0.5m | |
| Thu 30 Jul | Low | 14:10 | 0.2m |
| High | 22:00 | 0.5m | |
| Fri 31 Jul | Low | 05:10 | 0.3m |
| High | 09:00 | 0.3m | |
| Low | 15:00 | 0.2m | |
| High | 22:10 | 0.5m | |
| Sat 01 Aug | Low | 16:00 | 0.3m |
| High | 23:00 | 0.5m | |
| Sun 02 Aug | — | ||
| Mon 03 Aug | Low | 06:10 | 0.2m |
| Tue 04 Aug | High | 14:00 | 0.5m |
| Low | 19:00 | 0.3m | |