Valparaíso tide times
Valparaíso tide forecast — heights relative to MSL.
Today's tide times for Valparaíso
Tide times at Valparaíso on Sunday, 26 July 2026: first low tide at 01:15, first high tide at 08:03, second low tide at 14:56. Sunrise 07:41, sunset 18:04.
Tide chart for Valparaíso
24-hour cosine-interpolated curve around the present moment. Heights relative to MSL. Predictions: Predictions: Open-Meteo Marine (MeteoFrance SMOC, 0.08° grid).
Sun, moon and conditions on Sun 26 Jul
Snapshot at build time — refreshes daily. Sea state from Open-Meteo Marine.
Highs and lows next 7 days
Every predicted high and low for the next week, with the daily tidal coefficient (0–120; higher = bigger swing, > 95 means stronger currents).
Other spots nearby
The three closest curated TideTurtle locations to Valparaíso, measured by great-circle distance.
Today's solunar windows
Solunar tradition: major periods are the ≈3h windows around moon transit and opposition; minor are ≈2h around moonrise and moonset. Pair with the local tide stage and wind for the best read.
Cycle dates near Valparaíso
Next spring tide on Thu 30 Jul (range 1.4m). Last neap on Sat 25 Jul. Next neap on Wed 29 Jul.
Spring tides cluster around new and full moons (biggest swings). Neap tides land on quarter moons (smallest swings). See the spring tide and neap tide glossary entries for the why.
About tides at Valparaíso
A short guide to the coastline at Valparaíso — geography, sea state, and what the tide is actually doing under your feet.
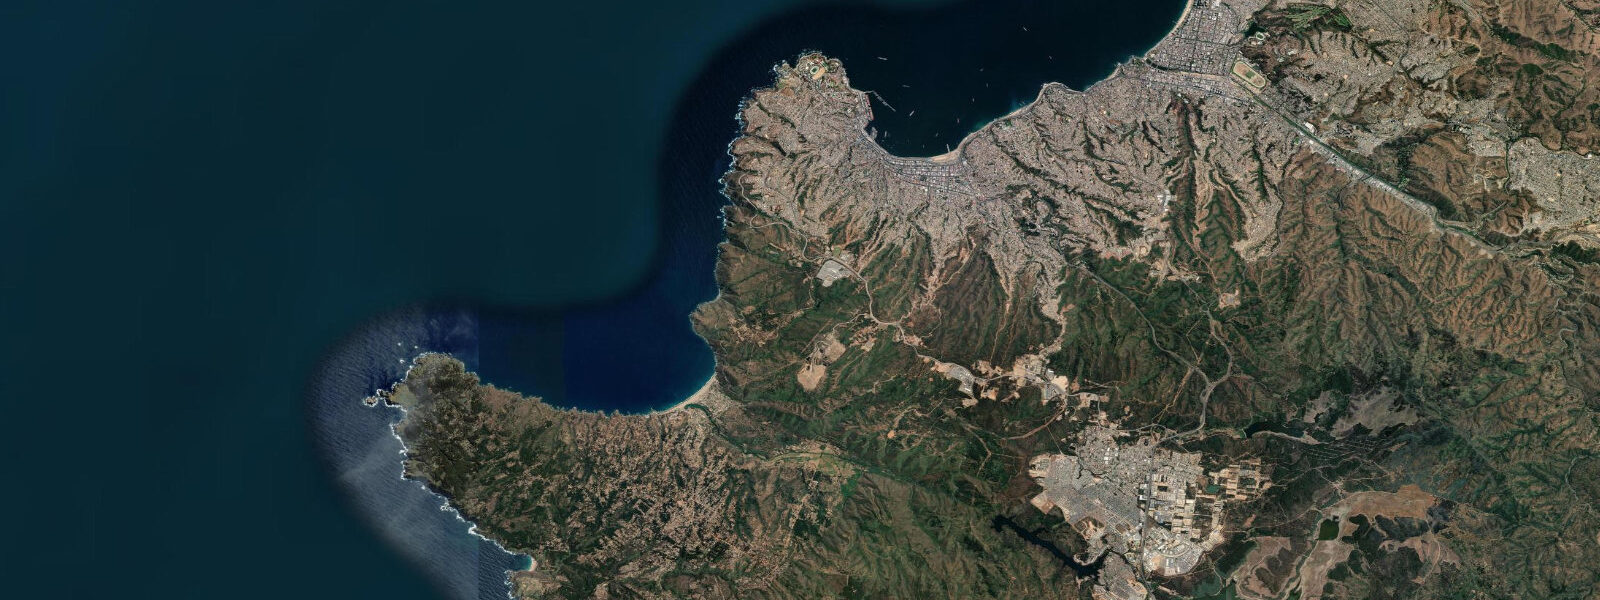
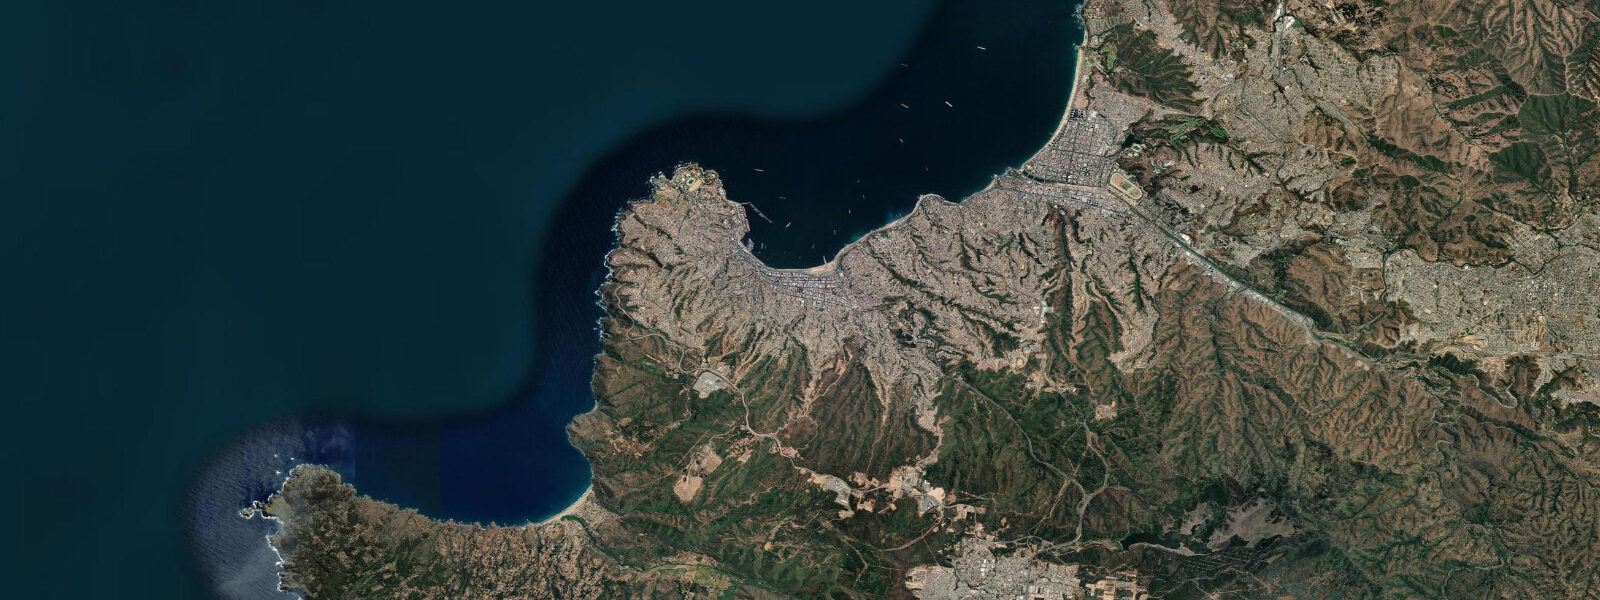
Valparaíso sits on the central Chilean Pacific coast at about 33 degrees south, the country's principal working port and the historic Pacific gateway between Cape Horn and the Panama Canal opening of 1914. The city wraps the long curve of the Bahía de Valparaíso between Punta Ángeles in the west and Punta Concón in the east, with Viña del Mar across the headland to the north and the Aconcagua river mouth feeding into the open Pacific further north still. 6 on neaps.
Two highs and two lows of unequal size each day, with the asymmetry between the higher high and the lower low varying through the lunar month. The defining oceanographic feature is the cold Humboldt Current that sweeps north along the Chilean coast from the Antarctic Circumpolar Current — sea-surface temperatures stay between 12 and 18 degrees year-round despite the mid-latitude position and the cold-water upwelling drives the Chilean industrial fishing economy. The defining historical events are the tsunami impacts.
5, north-central Chile) generated a Pacific-wide tsunami that struck Valparaíso harbour with run-up exceeding 9 metres in places and reshaped the early-twentieth-century waterfront engineering, with the city eventually building the seawall promenades and the dredged container channel that the modern working port uses. 5, southern Chile, the largest earthquake ever recorded by instrumentation) generated the trans-Pacific tsunami that killed people in Hawaii, Japan, and the Philippines and was felt at Valparaíso about 11 hours after the rupture as a series of 1 to 2 metre water-level oscillations through the harbour over several hours. The cerros (hill quarters) of Valparaíso climb the 45-degree slopes immediately above the working harbour — Cerro Concepción, Cerro Alegre, Cerro Bellavista, Cerro Artillería — and the funicular ascensor system has connected port-level workers to the residential cerros since 1883, with about 15 of the original 30 ascensores still operating.
UNESCO inscribed the historic quarter on the World Heritage list in 2003 for the urbanism and the cerro-and-port industrial heritage. The working container terminal at the Puerto de Valparaíso, the cruise calls, the Vergara Pier at Viña del Mar, the long sand at Reñaca and Concón, and the surf at Punta de Lobos and Pichilemu about 200 kilometres south on the open Pacific coast all read the table for different windows. The Chilean Navy Hydrographic and Oceanographic Service (SHOA) publishes the authoritative Chilean tide tables and operates the Pacific Tsunami Warning Center liaison station; Open-Meteo Marine drives the gridded predictions on this page.
Tide questions about Valparaíso
Quick answers to the most common questions about tide times, range, and water access at Valparaíso.
When is the next high tide at Valparaíso?
The hero block shows the next high tide at the Valparaíso harbour gauge in local Chilean time (CLT/CLST with DST — austral-summer DST in Chile). The 7-day table covers all daily highs and lows. The mixed semidiurnal pattern produces two highs and two lows of unequal size each day.
What's the typical tide range at Valparaíso?
Mean range at the Valparaíso harbour gauge is about 1.1 metres — a small open-Pacific mid-latitude signal. Spring tides push close to 1.5 metres and neaps drop near 0.6. The cold Humboldt Current keeps sea-surface temperatures between 12 and 18 degrees year-round despite the mid-latitude position, and the cold-water upwelling drives the Chilean industrial fishing economy.
Where do these tide predictions come from?
Open-Meteo Marine, a gridded global ocean model. Useful for planning Vergara Pier visits at Viña del Mar, the Reñaca and Concón beach windows, the funicular ascensor sessions in the cerros, and the working surf timing at Punta de Lobos and Pichilemu about 200 kilometres south. For authoritative Chilean tide data, the Chilean Navy Hydrographic and Oceanographic Service (SHOA) publishes the official tide tables and operates the Pacific Tsunami Warning Center liaison station.
What's the tsunami history at Valparaíso?
The 11 November 1922 Vallenar earthquake (Mw 8.5, north-central Chile) generated a Pacific-wide tsunami that struck Valparaíso harbour with run-up exceeding 9 metres in places and reshaped the early-twentieth-century waterfront engineering. The 22 May 1960 Valdivia earthquake (Mw 9.5, the largest earthquake ever recorded) generated the trans-Pacific tsunami that killed people in Hawaii, Japan, and the Philippines and was felt at Valparaíso about 11 hours after the rupture as a series of 1 to 2 metre water-level oscillations through the harbour over several hours. The Chilean Navy SHOA operates the Pacific Tsunami Warning Center liaison station and the modern early-warning network.
Is this safe to use for navigation?
No. For piloting in or out of the Puerto de Valparaíso, the Vergara Pier cruise terminal at Viña del Mar, or any Pacific approach use the Chilean Navy Hydrographic and Oceanographic Service (SHOA) authoritative tide tables, the Empresa Portuaria Valparaíso pilotage guidance, and the Pacific Tsunami Warning Center advisories during regional earthquake events. The Humboldt-Current-driven sea-state and the tsunami-history seismic hazard require working pilotage.
7-day tide table — Valparaíso
Heights relative to MSL. Predictions: Open-Meteo Marine (MeteoFrance SMOC, 0.08° grid) — heights relative to MSL (not chart datum / LAT). Model-derived.
| Day | Type | Time | Height |
|---|---|---|---|
| Sun 26 Jul | Low | 01:15 | -0.3m |
| High | 08:03 | 0.6m | |
| Low | 14:56 | -0.4m | |
| Mon 27 Jul | High | 08:40 | 0.7m |
| Low | 15:36 | -0.4m | |
| High | 21:10 | 0.2m | |
| Tue 28 Jul | Low | 02:35 | -0.4m |
| High | 09:17 | 0.7m | |
| Low | 16:06 | -0.5m | |
| High | 21:48 | 0.2m | |
| Wed 29 Jul | Low | 03:10 | -0.4m |
| High | 09:55 | 0.8m | |
| Low | 16:39 | -0.4m | |
| High | 22:24 | 0.3m | |
| Thu 30 Jul | Low | 17:08 | -0.4m |
| High | 22:54 | 0.4m | |
| Fri 31 Jul | Low | 04:25 | -0.4m |
| High | 10:58 | 0.9m | |
| Low | 17:39 | -0.5m | |
| Sat 01 Aug | High | 11:26 | 0.8m |
| Low | 18:08 | -0.5m |