Adelaide tide times
Adelaide tide forecast — heights relative to MSL.
Today's tide times for Adelaide
Tide times at Adelaide on Friday, 31 July 2026: first low tide at 11:06, first high tide at 17:18. Sunrise 07:41, sunset 18:02.
Tide chart for Adelaide
24-hour cosine-interpolated curve around the present moment. Heights relative to MSL. Predictions: Predictions: Open-Meteo Marine (MeteoFrance SMOC, 0.08° grid).
Sun, moon and conditions on Fri 31 Jul
Snapshot at build time — refreshes daily. Sea state from Open-Meteo Marine.
Highs and lows next 7 days
Every predicted high and low for the next week, with the daily tidal coefficient (0–120; higher = bigger swing, > 95 means stronger currents).
Other spots nearby
The three closest curated TideTurtle locations to Adelaide, measured by great-circle distance.
Today's solunar windows
Solunar tradition: major periods are the ≈3h windows around moon transit and opposition; minor are ≈2h around moonrise and moonset. Pair with the local tide stage and wind for the best read.
Cycle dates near Adelaide
Next spring tide on Sat 01 Aug (range 2.1m). Next neap on Thu 06 Aug.
Spring tides cluster around new and full moons (biggest swings). Neap tides land on quarter moons (smallest swings). See the spring tide and neap tide glossary entries for the why.
About tides at Adelaide
A short guide to the coastline at Adelaide — geography, sea state, and what the tide is actually doing under your feet.
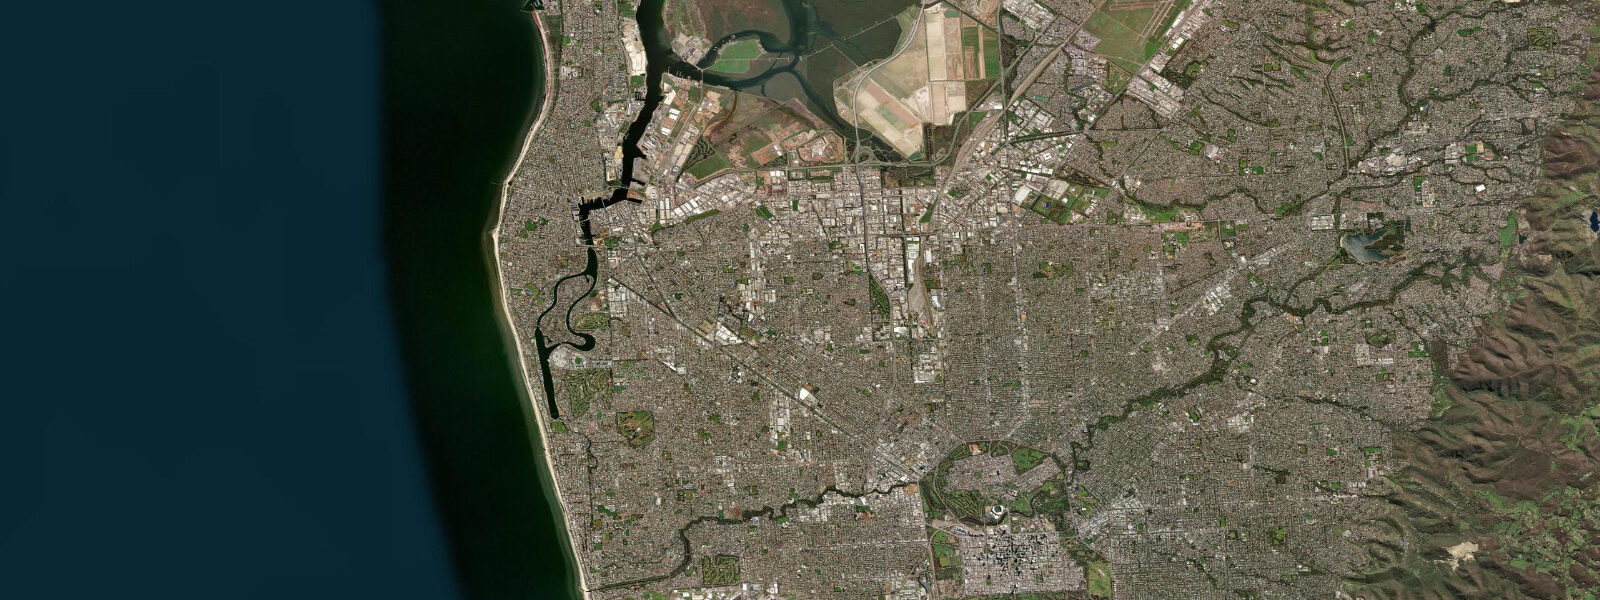
Adelaide faces Gulf St Vincent, a 150 km enclosed embayment between the Fleurieu and Yorke peninsulas, open at its southern end to the Great Australian Bight and the Southern Ocean beyond. The gulf's enclosed geometry produces a tidal regime that is genuinely unusual: spring ranges of 1.5 to 2.0 m are modest, but the tidal pattern in Adelaide shifts between semidiurnal and pronounced diurnal inequality depending on where the moon sits in its monthly cycle. On some days, the tide chart shows two roughly equal highs and two lows. On others, one high towers over a barely-perceptible secondary high — the coast behaves almost as a single-tide system. This is not a rounding error or a data artefact; it is a real feature of Gulf St Vincent's resonance, documented in tidal surveys going back to the nineteenth century. For anyone timing an activity to the tide, reading the actual prediction for the specific day matters more than any rule of thumb.
For Adelaide's coastal community this shapes practical decisions differently than a clean semidiurnal coast would. Anglers targeting bream and mulloway in the Barker Inlet and the Onkaparinga River estuary know that on a strongly diurnal day there is effectively one productive tide change, not two, and that the slack period before the single dominant high is longer and more defined. Kayakers on the Port River plan their return from the dolphin sanctuary to avoid being caught by a fast-rising flood on a diurnal day, when the interval between low and high is longer on one side and shorter on the other than the standard six-hour split. The tidal prediction is the operating manual.
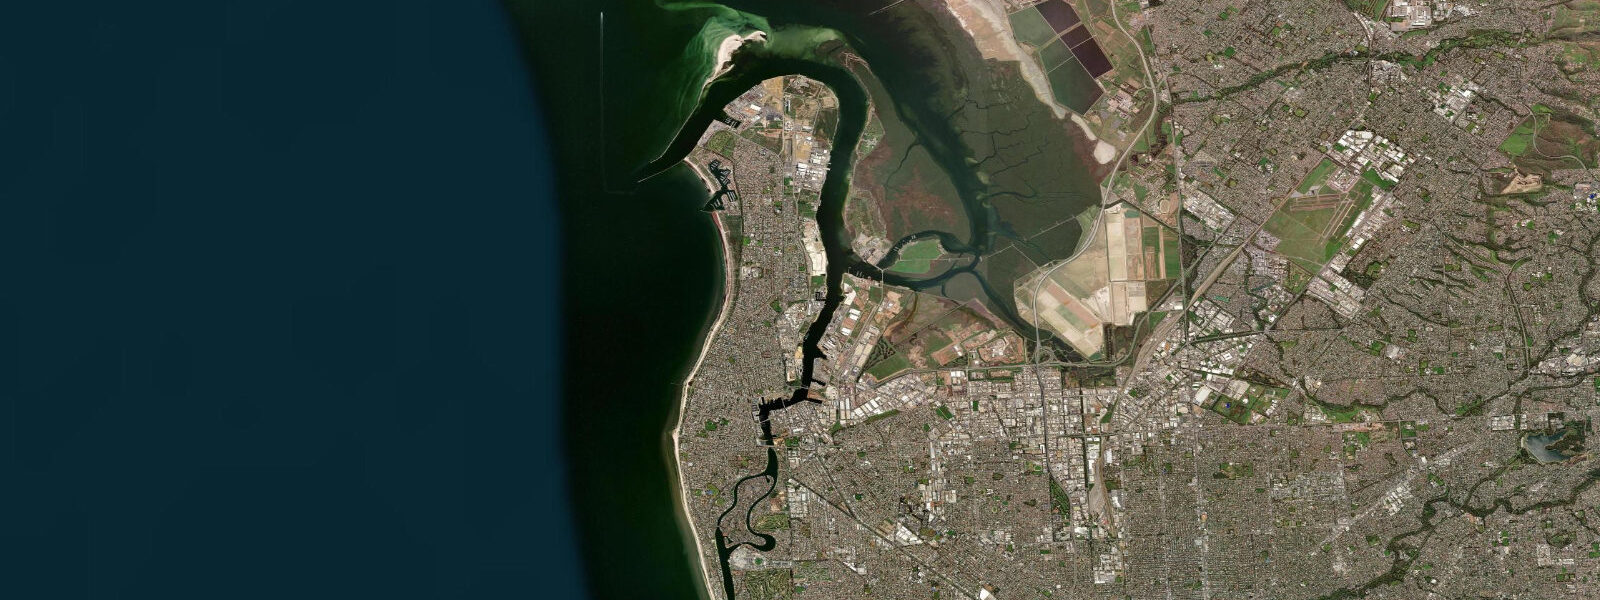
The St Kilda mangroves at the mouth of the Barker Inlet, roughly 20 km north of the CBD, are the most accessible tidal habitat on the Adelaide coast. At low water, the mudflat and pneumatophore field extend 50 to 100 m beyond the mangrove fringe, exposing foraging ground for wading birds including red-necked stints, sharp-tailed sandpipers, curlew sandpipers, and the occasional red-necked phalarope on passage. The St Kilda Mangrove Trail boardwalk and the adjacent Barker Inlet Wetlands give on-foot access to the fringe; the productive birdwatching window is the two hours around low tide, when the birds are concentrated on the exposed mud rather than scattered across flooded areas. Photographers working the sunrise light from the eastern shore of the inlet have roughly a 90-minute window before the tide turns the mud back under water.
The Port River north of Birkenhead, flowing through the industrial port precinct, holds the Adelaide Dolphin Sanctuary — a population of around 30 to 60 resident common bottlenose dolphins that live in the river and adjacent gulf waters year-round. The dolphins use tidal flow actively: on the flood they move upriver into the tidal reach to feed on fish aggregating over the shallow margins, then drop back downstream on the ebb. Dolphin-watching boat operators on the river time their departures to intercept the movement. The Port River is also an industrial working waterway — bulk carriers and container ships use the inner harbour at Port Adelaide — and dolphins navigate the same tidal reaches as commercial traffic, making the Port River one of the odder wildlife experiences in an Australian capital city.
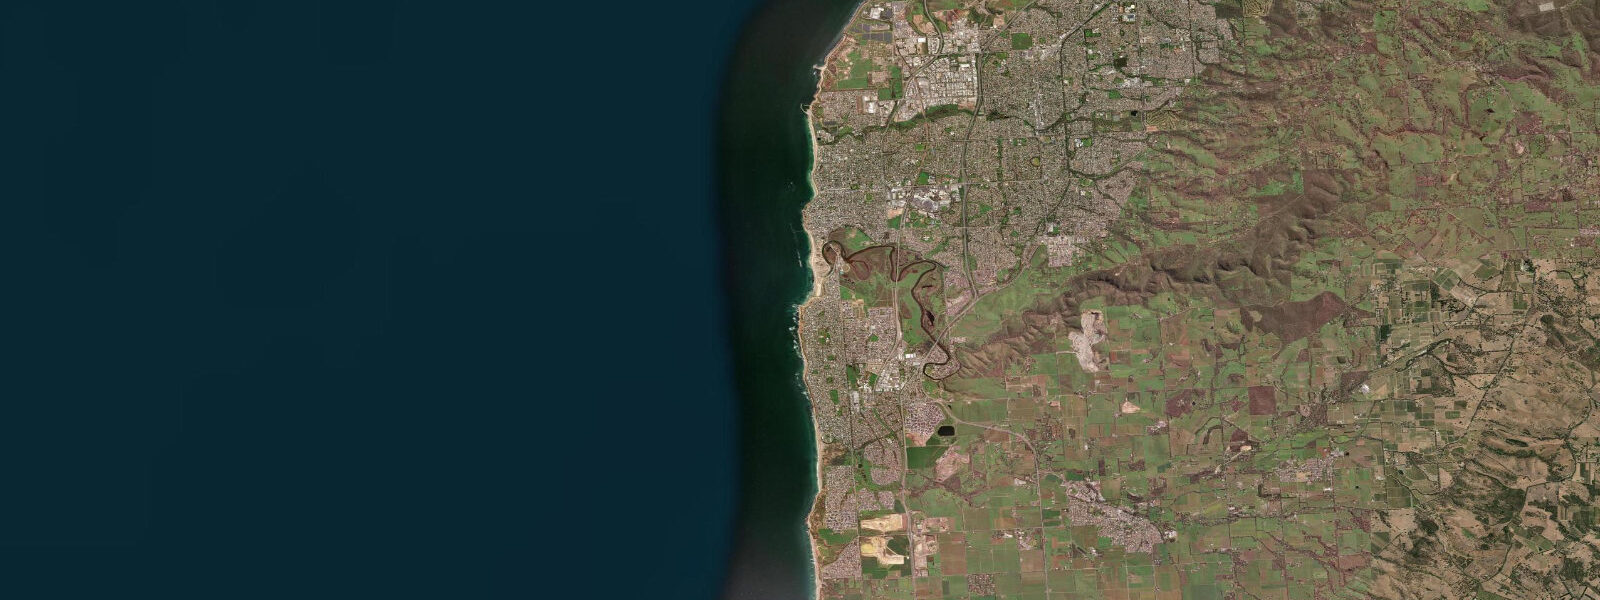
The Onkaparinga River estuary at Port Noarlunga, 25 km south of the CBD, is a calmer tidal environment. A sandbar across the river mouth partially restricts tidal exchange, creating brackish lagoonal conditions in the middle estuary that suit bream, mullet, and the occasional yellowfin whiting. The river is navigable by kayak from the boat ramp at Old Noarlunga to the mouth at tides above roughly 0.5 m, and the estuary walls and the cliff-lined lower reach are scenic in a way that the industrial north of the city is not. The Onkaparinga Regional Council manages a kayak trail with markers through the tidal reach; the trail is practical on rising tide, challenging on the ebb when the current exceeds 2 knots at the mouth constriction.
The gulf's sheltered character means it does not generate surf — the Southern Ocean swell that hits the exposed Coorong coast to the southeast and the Yorke Peninsula's outer shores is entirely blocked by the peninsula arms. Gulf St Vincent is a flat-water coastal environment suited to kayaking, sailing dinghies, stand-up paddleboarding, and family beach swimming, with water temperatures warmer than the Fleurieu Peninsula's ocean-facing beaches due to the gulf's relative shallowness and solar heating. The beaches at Glenelg, Henley, and West Beach are the main metropolitan swimming and recreational beaches; they sit on the gulf shore and are tide-affected, with the beach width varying noticeably between high and low water at a spring range of 1.5 to 2.0 m.
Predictions on this page come from Open-Meteo Marine, a gridded global ocean model — typically within plus or minus 45 minutes on timing and 0.2 to 0.3 m on height, model-derived, not a local gauge. The Bureau of Meteorology (BOM) maintains the official Adelaide tide gauge at Port Adelaide and publishes harmonic predictions for Gulf St Vincent. For any activity where the precise tidal phase matters — particularly on days when the diurnal inequality is at its maximum — use BOM's published predictions.
Tide questions about Adelaide
Quick answers to the most common questions about tide times, range, and water access at Adelaide.
When is the next high tide in Adelaide?
Check the tide predictions on this page — Adelaide's tidal pattern is unusual enough that a general answer is unreliable. Gulf St Vincent switches between semidiurnal (two roughly equal highs per day) and strongly diurnal (one dominant high, one barely perceptible secondary high) depending on lunar phase. On a semidiurnal day there are two highs roughly 12 to 13 hours apart. On a diurnal day there is effectively one dominant high. The spring range is 1.5 to 2.0 m. The Bureau of Meteorology publishes official harmonic predictions for Port Adelaide; the predictions on this page come from Open-Meteo Marine, a gridded ocean model typically accurate to within plus or minus 45 minutes on timing and 0.2 to 0.3 m on height.
What is the tidal range in Gulf St Vincent at Adelaide?
Spring tidal range at Adelaide runs approximately 1.5 to 2.0 m, classed as mesotidal. Neap tides produce a noticeably smaller swing. The defining characteristic of Adelaide's tidal regime is not the range but the inequality: the gulf's resonance causes the two daily highs to differ dramatically in some parts of the lunar cycle, shifting from a clear semidiurnal pattern toward near-diurnal behaviour. This is documented in Bureau of Meteorology tide records and is a known feature of the gulf's geometry. On a strong diurnal day, the secondary high may be only 0.3 to 0.4 m above the low, while the dominant high reaches 1.8 to 2.0 m — effectively a single main tide per day.
Where do the Adelaide tide predictions on this page come from?
Open-Meteo Marine, a free gridded global ocean model. The model estimates tidal height across a geographic grid rather than computing from harmonic analysis of the Port Adelaide gauge directly. Accuracy is typically within plus or minus 45 minutes on timing and 0.2 to 0.3 m on height — model-derived, not a local gauge. The Bureau of Meteorology (BOM) maintains the authoritative Port Adelaide tide gauge and publishes harmonic predictions for Gulf St Vincent ports. For any activity where the diurnal inequality matters — fishing the tide change windows, navigating the tidal reaches of the Onkaparinga or Port Rivers — use BOM's predictions.
When is the best time to visit the St Kilda mangroves and Barker Inlet for birdwatching?
The two hours centred on low tide are the productive window. At low water the mudflat and pneumatophore field beyond the mangrove fringe are exposed, concentrating wading birds — red-necked stints, sharp-tailed sandpipers, curlew sandpipers — on visible foraging ground. As the tide floods back the birds disperse or move into the mangrove canopy. Early morning light from the eastern shore of the inlet is best for photography, which means timing a low tide to fall in the first two hours after sunrise. Check the tide table for the day: on a strongly diurnal day there may be only one useful low tide window. The St Kilda Mangrove Trail boardwalk and the Barker Inlet Wetlands give foot access without needing to cross the mudflat.
Can I kayak to see the dolphins in the Port River Dolphin Sanctuary?
The Port River dolphin population is visible from both commercial tour boats and, at appropriate distances, from kayaks launched from the Port Adelaide or Birkenhead waterfront. The dolphins follow tidal flow into the upper river on the flood and drop back on the ebb — timing a paddle to coincide with an incoming tide gives the best chance of an upriver encounter. The river is an active industrial port with commercial shipping in the main channel; kayakers must stay clear of vessel traffic lanes and should not approach dolphins closer than 30 m under South Australian wildlife protection guidelines. Guided tours from operators licensed under the sanctuary regulations are the recommended option for visitors unfamiliar with the port geography.
8-day tide table — Adelaide
Heights relative to MSL. Predictions: Open-Meteo Marine (MeteoFrance SMOC, 0.08° grid) — heights relative to MSL (not chart datum / LAT). Model-derived.
| Day | Type | Time | Height |
|---|---|---|---|
| Fri 31 Jul | Low | 11:06 | -0.7m |
| High | 17:18 | 1.0m | |
| Sat 01 Aug | Low | 00:05 | -1.0m |
| High | 05:51 | 0.5m | |
| Low | 11:33 | -0.8m | |
| High | 17:50 | 1.1m | |
| Sun 02 Aug | Low | 00:27 | -0.9m |
| High | 06:21 | 0.7m | |
| Low | 12:00 | -0.6m | |
| High | 18:19 | 1.3m | |
| Mon 03 Aug | Low | 00:53 | -0.7m |
| High | 06:45 | 0.8m | |
| Low | 12:45 | -0.6m | |
| High | 18:41 | 0.8m | |
| Tue 04 Aug | Low | 01:01 | -0.9m |
| High | 07:11 | 0.7m | |
| Low | 13:13 | -0.7m | |
| High | 19:08 | 0.6m | |
| Wed 05 Aug | Low | 01:26 | -0.9m |
| High | 07:41 | 0.7m | |
| Low | 13:52 | -0.6m | |
| High | 19:34 | 0.4m | |
| Thu 06 Aug | Low | 01:47 | -0.8m |
| High | 08:18 | 0.6m | |
| Fri 07 Aug | Low | 01:50 | -0.4m |
| High | 09:00 | 0.9m |