Port Stephens, NSW tide times
Port Stephens, NSW tide forecast — heights relative to MSL.
Today's tide times for Port Stephens, NSW
Tide times at Port Stephens, NSW on Sunday, 26 July 2026: first low tide at 10:54, first high tide at 17:35. Sunrise 06:46, sunset 17:09.
Tide chart for Port Stephens, NSW
24-hour cosine-interpolated curve around the present moment. Heights relative to MSL. Predictions: Predictions: Open-Meteo Marine (MeteoFrance SMOC, 0.08° grid).
Sun, moon and conditions on Sun 26 Jul
Snapshot at build time — refreshes daily. Sea state from Open-Meteo Marine.
Highs and lows next 7 days
Every predicted high and low for the next week, with the daily tidal coefficient (0–120; higher = bigger swing, > 95 means stronger currents).
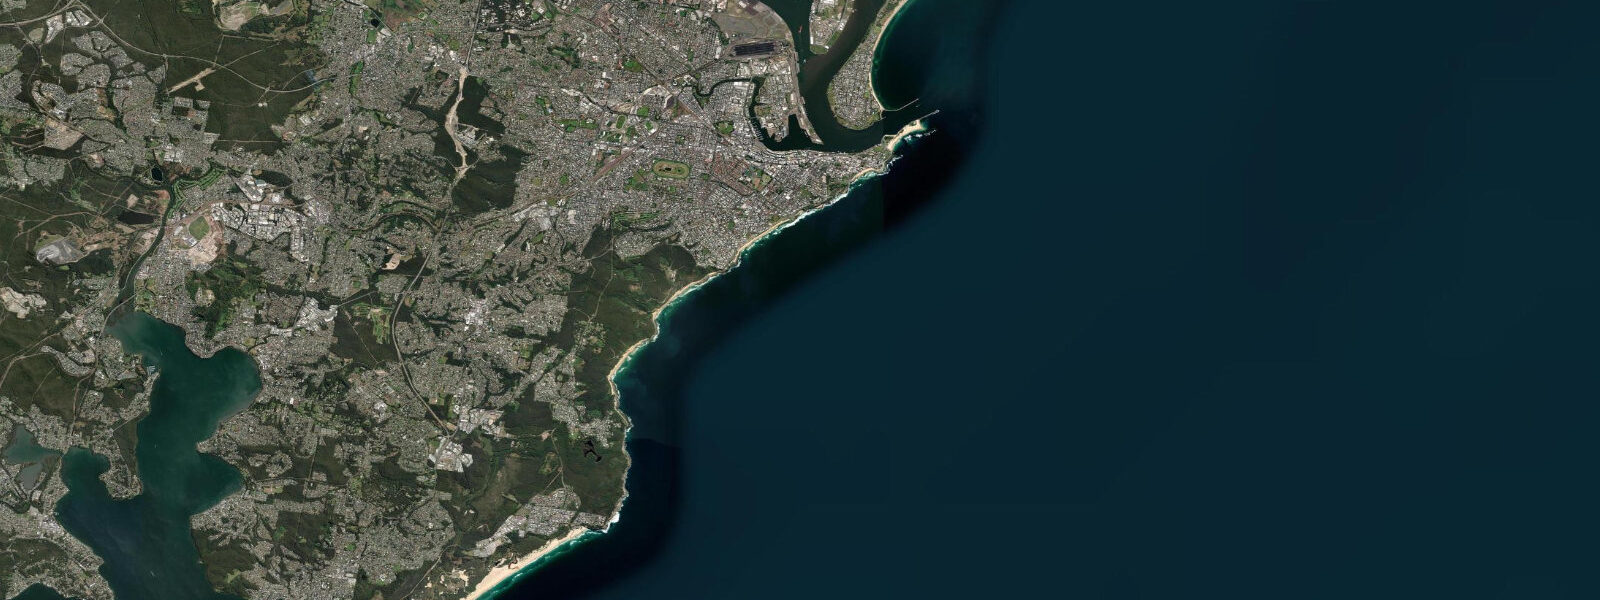
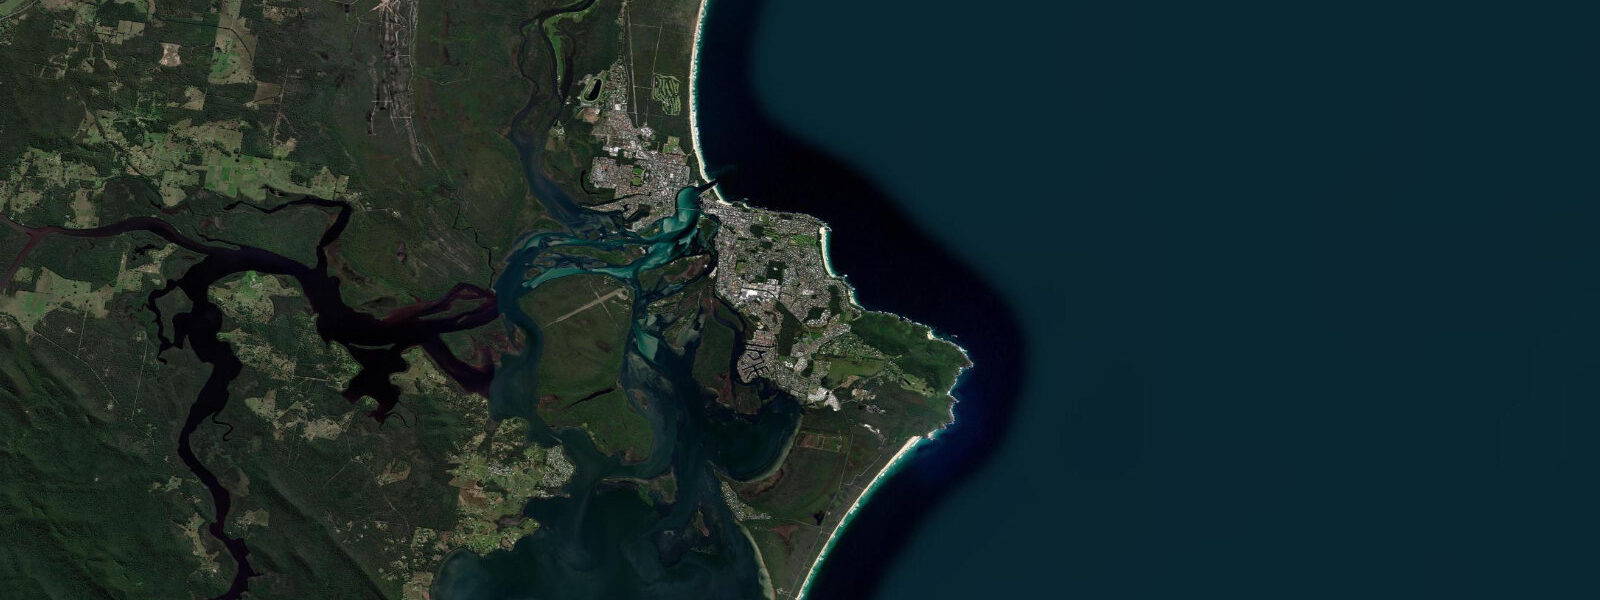
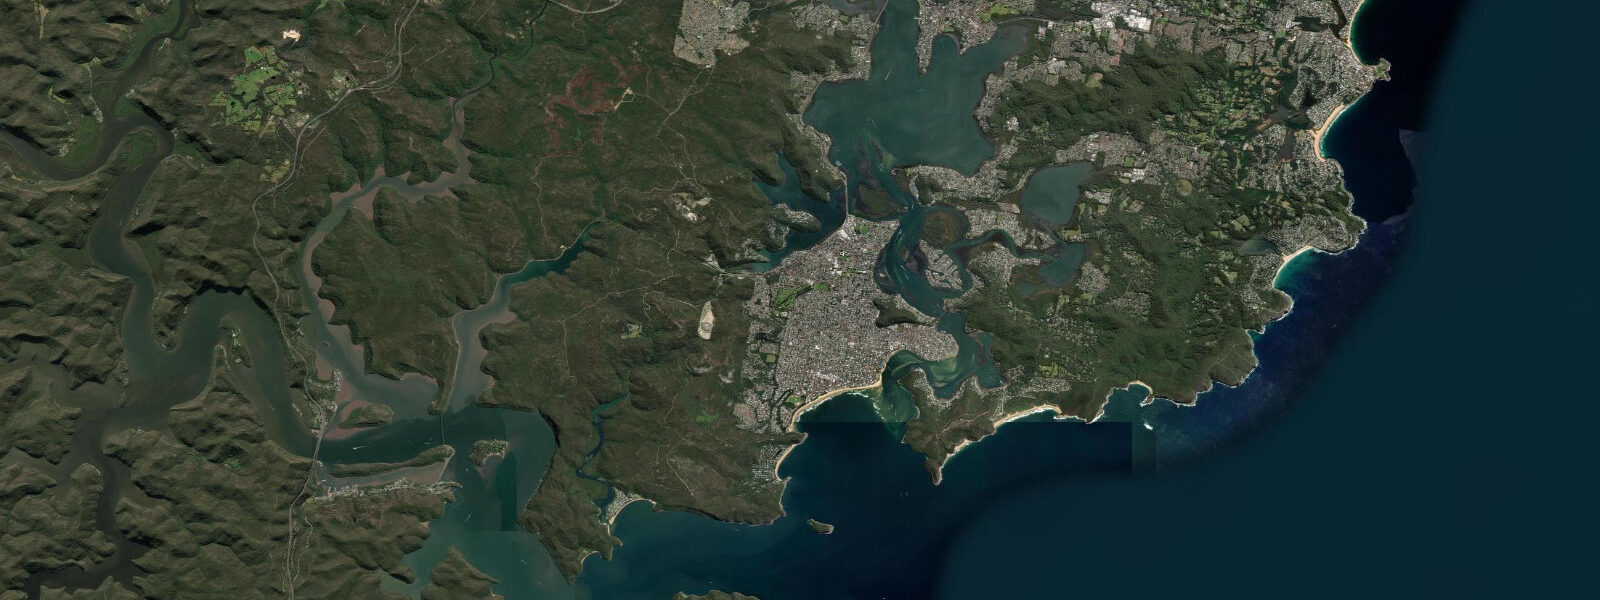
Other spots nearby
The three closest curated TideTurtle locations to Port Stephens, NSW, measured by great-circle distance.
Today's solunar windows
Solunar tradition: major periods are the ≈3h windows around moon transit and opposition; minor are ≈2h around moonrise and moonset. Pair with the local tide stage and wind for the best read.
Cycle dates near Port Stephens, NSW
Next spring tide on Fri 31 Jul (range 1.5m). Last neap on Sun 26 Jul. Next neap on Sat 01 Aug.
Spring tides cluster around new and full moons (biggest swings). Neap tides land on quarter moons (smallest swings). See the spring tide and neap tide glossary entries for the why.
About tides at Port Stephens, NSW
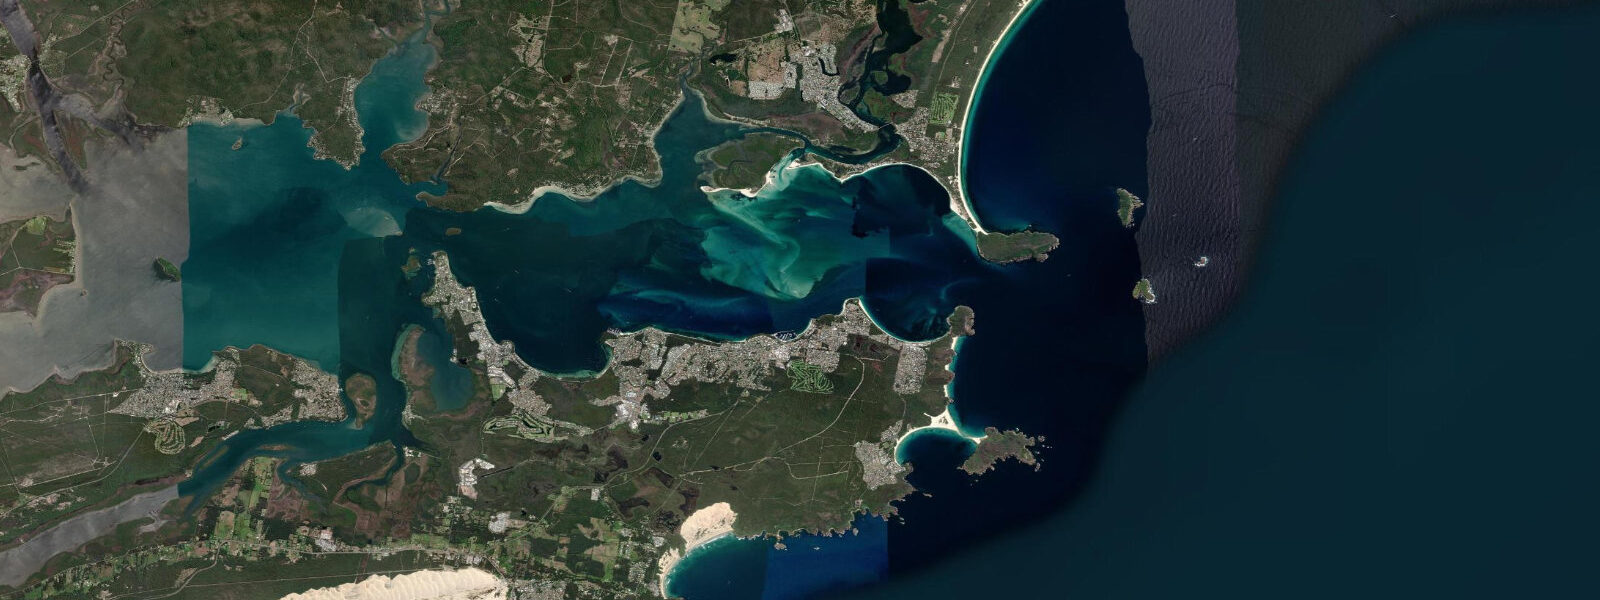
A short guide to the coastline at Port Stephens, NSW — geography, sea state, and what the tide is actually doing under your feet.
Port Stephens is the deep natural harbour about 200 km north of Sydney, on the New South Wales mid-coast where the Karuah and Myall rivers drain into one of the larger embayments on the east Australian coast. The harbour is more than twice the area of Sydney Harbour and famously hosts a resident population of bottlenose dolphins. The tide here runs the standard east-Australian semidiurnal signal: two highs and two lows of comparable size each day, twelve and a half hours apart.
7 on spring tides. The narrow harbour entrance concentrates flow and the current on the change of tide runs sharper than the height swing implies, with eddies on both flanks. Slack water is the quiet crossing window.
The wide white sand at Shoal Bay, Fingal Bay, and the long surf beaches at Birubi Point widen by 10–15 metres at low water and the dunes at Stockton Beach south of the heads run the largest active dune system on the NSW coast. Predictions on this page come from Open-Meteo's gridded marine model. The Australian Bureau of Meteorology and the NSW Roads and Maritime Services publish authoritative tide tables for the Port Stephens entrance.
Tide questions about Port Stephens, NSW
Quick answers to the most common questions about tide times, range, and water access at Port Stephens, NSW.
When is the next high tide at Port Stephens?
The hero block shows the next high tide at the Port Stephens entrance in local Australian Eastern time. The 7-day table covers all four daily extremes. High water at the inner harbour at Soldiers Point lags the entrance by 30–45 minutes; high water at the head of the Karuah River lags by an hour or more.
What's the typical tide range at Port Stephens?
Mean range at the entrance is about 1.3 metres, with spring tides pushing toward 1.7 metres and neaps dropping near 0.8. The signal closely tracks Sydney Harbour 200 km south on the same coast — modest in absolute terms but the harbour geometry makes the entrance currents run harder than the height swing implies.
When is best for paddling across the harbour?
Slack water is the calmest crossing window — about thirty minutes either side of high or low. Strong ebb against an incoming swell at the entrance produces standing chop at the heads that catches paddlers out, especially on spring tides. The 7-day table on this page flags slack times. Wind-against-tide is the dangerous combination at the entrance.
Where do these tide predictions come from?
Open-Meteo's marine model produces the gridded predictions on this page — general-planning data, not navigation-grade. The Bureau of Meteorology runs the authoritative gauge at the entrance and publishes harmonic tide tables. Maritime NSW publishes specific guidance for the Port Stephens bar entry.
Is this safe to use for navigation?
No. For piloting in or out of the Port Stephens heads, transiting the bar, or working the inner harbour channels use BoM's authoritative tide tables, the latest Notices to Mariners, and Maritime NSW's published bar conditions. The bar runs hard on the change of tide and breaking seas at the heads on a spring ebb against an east swell are a real hazard, not a planning matter.
8-day tide table — Port Stephens, NSW
Heights relative to MSL. Predictions: Open-Meteo Marine (MeteoFrance SMOC, 0.08° grid) — heights relative to MSL (not chart datum / LAT). Model-derived.
| Day | Type | Time | Height |
|---|---|---|---|
| Sun 26 Jul | Low | 10:54 | -0.2m |
| High | 17:35 | 0.8m | |
| Mon 27 Jul | Low | 00:36 | -0.3m |
| High | 06:16 | 0.3m | |
| Low | 11:40 | -0.2m | |
| High | 18:25 | 0.9m | |
| Tue 28 Jul | Low | 01:11 | -0.4m |
| High | 07:00 | 0.4m | |
| Low | 12:20 | -0.3m | |
| High | 19:00 | 0.9m | |
| Wed 29 Jul | Low | 01:47 | -0.4m |
| High | 07:35 | 0.4m | |
| Low | 13:02 | -0.3m | |
| High | 19:38 | 0.9m | |
| Thu 30 Jul | Low | 02:18 | -0.5m |
| High | 08:15 | 0.4m | |
| Low | 13:38 | -0.4m | |
| High | 20:15 | 0.9m | |
| Fri 31 Jul | Low | 02:50 | -0.5m |
| High | 08:48 | 0.5m | |
| Low | 14:17 | -0.4m | |
| High | 20:47 | 0.9m | |
| Sat 01 Aug | Low | 03:22 | -0.6m |
| High | 09:21 | 0.5m | |
| Low | 14:58 | -0.4m | |
| High | 21:22 | 0.8m | |
| Sun 02 Aug | Low | 03:55 | -0.6m |
| High | 09:00 | 0.4m |